


Geopolitical tensions and trade policy uncertainty are injecting unpredictability into global financial markets. What seems like rock-solid market sentiment today can turn into jitters tomorrow. In this ECB Blog, we present a new risk appetite indicator to systematically track such shifts in market sentiment.
Market swings – important beyond the trading floor
Central banks need to keep an eye on market sentiment as it signals what investors think about the future. Investors’ willingness to take risk today is determined by their view on the broader economic outlook of tomorrow and the level of uncertainty they associate with it. This, in turn, has macroeconomic ramifications and can lead to self-reinforcing feedback loops. Periods of positive market sentiment can contribute to easier financing conditions and could boost economic activity. On the other hand, a sustained lack of risk-taking may tighten financing conditions for businesses, governments and private households. Understanding the current mood of investors is therefore vital for understanding broader macroeconomic developments and their implications for monetary policy.
There are different ways to measure the mood of investors and their risk appetite. Financial asset prices can help policymakers get broad-based, real-time information on investor sentiment.[1] Existing market-based approaches like the Composite Indicator of Systematic Stress (CISS) focus specifically on systemic stress in the financial and banking systems.[2] In this blog post, we present a new measure to gauge market sentiment more generally. Our indicator takes a more holistic perspective on the pricing of euro area assets beyond periods of stress. This allows us to grasp market sentiment for periods of both market optimism and market caution, commonly labelled “risk-on” and “risk-off”, and the transition between them.
How to quantify market sentiment
Let’s take a closer look. To construct the euro area risk appetite indicator, we follow the methodology of Bauer, Bernanke and Milstein (2023), who apply principal component analysis to asset prices in the United States.[3] This statistical method makes it possible to distil information from different financial indicators into a single, easy-to-interpret indicator at daily frequency.[4] To get a better idea of investor sentiment, our indicator is based on shifts in risk premia across different asset classes. This is the compensation investors require over a risk-free investment alternative. If markets are sensitive to risk and thus investing cautiously, they demand higher compensation in situations they deem critical. If they are optimistic about market conditions, by contrast, risk premia are lower. At the same time, combining changing asset prices in a single index avoids overemphasising isolated spikes in market prices that emerge from specific asset classes or indicators. For example, by focusing exclusively on fear indicators in equity markets, such as the VSTOXX, we might overlook important information about risk appetite coming from bond or currency markets. Specifically, the resulting risk appetite indicator is based on ten financial variables. These include equity indices like the Euro STOXX 50, volatility indices like the VSTOXX, sovereign and corporate bond spreads, and exchange rates like that of the euro to the US dollar.[5]
Chart 1: Changes in euro area risk appetite
(standard deviation)
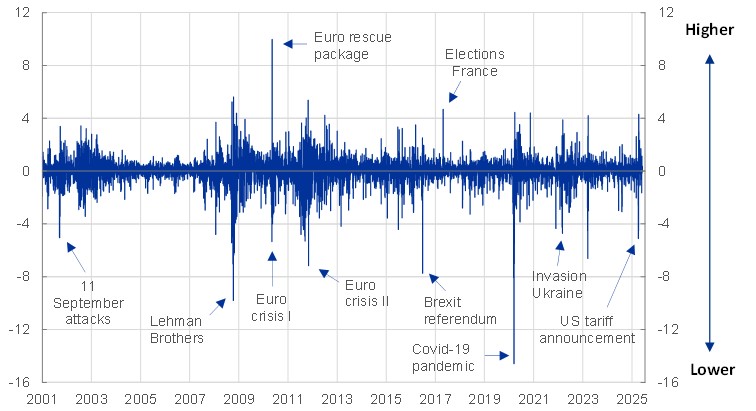
Sources: Bloomberg, ICE BofA, LSEG and ECB calculations.
Notes: Daily changes in euro area risk appetite, based on the methodology of Bauer, Bernanke and Milstein (see footnote 3). The indicator represents the first principal component of several financial indicators, including equities, volatility, sovereign and corporate bond spreads, and exchange rates, for a total of ten individual variables. It is normalised to have a mean of 0 and a standard deviation of 1. The latest observations are for 3 June 2025.
The risk appetite index, measured in daily changes, is illustrated in Chart 1. As the timeline shows, the index closely follows what economic intuition would suggest. In times of stress, risk appetite falls; in times of certainty and optimism, it rises. For instance, the recent US tariff announcement led to sharp swings in risk appetite caused by a substantial rise in global economic uncertainty. In addition, the risk appetite index was very responsive to euro area-specific events, such as the sovereign debt crisis, the Brexit referendum in 2016 and the French presidential election in 2017.
Historically elevated risk appetite on both sides of the Atlantic
Chart 2: Risk appetite indices: euro area and US levels; differences between levels
(standard deviation)

Sources: Bloomberg, Moody’s, ICE BofA, LSEG and ECB calculations.
Notes: The top panel shows the levels of the euro area (EA) and US risk appetite indicators, based on the methodology of Bauer, Bernanke and Milstein (see footnote 3). The indices are normalised to have a mean of 0 and a standard deviation of 1. A value above 0 indicates that the level of risk appetite exceeds the historical average, while a value below 0 suggests the opposite. The bottom panel shows the difference between the two indicators, with positive values indicating higher risk appetite in the euro area than in the United States with respect to both indicators’ full-sample history, and vice versa for negative values.
The latest observations are for 3 June 2025.
We can compute the level of risk appetite by aggregating and normalising the daily changes shown in Chart 1. This helps to more clearly identify protracted periods of strong or weak risk sentiment, thereby providing historical context and allowing for better comparisons of the relative movements between countries or regions.[6],[7] The top panel of Chart 2 highlights the strong co-movement across the euro area and the United States. The parallel development in market sentiment suggests a common trend on both sides of the Atlantic. The overlap is particularly striking in times of recession, as both indices display considerable dips pointing in the same direction. These findings illustrate the link between economic activity and risk appetite, and the existence of a global factor in risk premia.[8] Though impacted by global events, the level of risk appetite can vary significantly across different regions and countries. This is demonstrated over the observed time frame in the bottom panel of Chart 2. Regional differences in the level of investor risk appetite between the euro area and the United States become evident, especially during periods of sharp declines.
Chart 3: Changes in risk appetite in selected periods
(standard deviation)
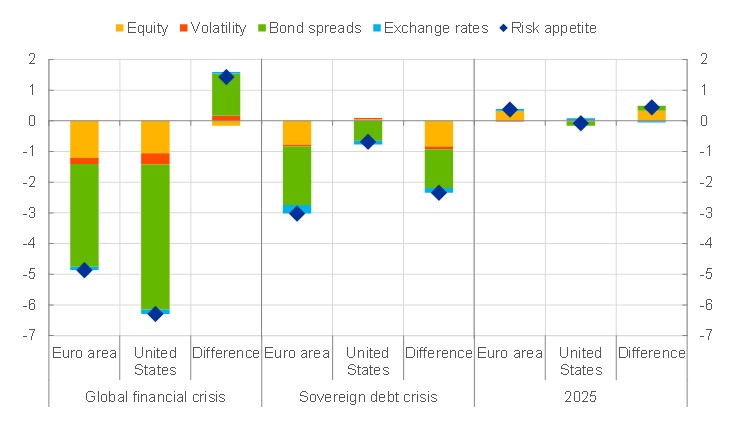
Sources: Bloomberg, Moody’s, ICE BofA, LSEG and ECB calculations.
Notes: The chart shows the changes in euro area and US risk appetite indicators and the difference between the two (euro area minus US) for the respective periods. The values at the peak of the difference between the two are used and compared against a reference date. The global financial crisis is defined as the period from 1 August 2007 to 4 December 2008 and the sovereign debt crisis as the period from 1 January 2010 to 6 January 2012. The latest observations are for 3 June 2025.
Two major episodes of financial turmoil are pertinent examples for events with a severe, albeit divergent impact on risk appetite: the global financial crisis and the euro area sovereign debt crisis. Chart 3 zooms in on how risk appetite in the euro area and the United States evolved during these episodes. For both episodes, the chart shows the changes in the levels of the euro area and US risk appetite indices (from Chart 2, top panel) and changes in the difference between the euro area and US levels (from Chart 2, bottom panel). To get a better idea what drove investor sentiment, it provides a breakdown of factors. Specifically, it attributes those changes to contributions from the equity, volatility, bond-spread and exchange-rate components of the risk appetite index.
In both cases, investor sentiment deteriorated in the euro area and the United States as economic conditions worsened. However, while the global financial crisis had a significantly larger impact than the sovereign debt crisis in both regions, the two episodes exhibit striking regional differences. For the global financial crisis, which emanated from the mortgage market in the United States, risk appetite decreased somewhat more strongly for the United States. By contrast, the sovereign debt crisis in the euro area had a visibly stronger effect on risk appetite on this side of the Atlantic. Such divergence could be seen across asset classes, though bond markets played the dominant role in driving risk appetite and the gap between the two regions.
Monitoring investor mood in recent market conditions
Finally, turning to more recent developments, Chart 3 also shows that since the start of 2025, net risk appetite has increased slightly for the euro area and remained almost unchanged for the United States. Yet, as the more detailed underlying dynamics in Chart 2 (zoom window) reveal, this masks considerable volatility in recent months. At the beginning of the year, risk appetite in the euro area – unlike in the United States – continued to rise from the already elevated levels that had persisted throughout 2024. This was followed by a rapid souring of euro area risk appetite amid trade-related uncertainty, which put an end to the temporary decoupling of euro area risk appetite from its US counterpart. Consistent with this, more encouraging trade-related news out of the United States then drove a rebound in risk appetite in the euro area. Intuitively, the picture for the United States – from where the trade shock emanated – looks slightly less favourable on balance. Recent months have again illustrated that market sentiment can shift fast in both directions. The risk appetite indicator presented in this blog helps central banks to summarise and monitor such mood swings in real time.
The views expressed in each blog entry are those of the author(s) and do not necessarily represent the views of the European Central Bank and the Eurosystem.
Check out The ECB Blog and subscribe for future posts.
For topics relating to banking supervision, why not have a look at The Supervision Blog?
Surveys are another way to measure this. These can provide very useful information, especially if they directly assess investors’ risk attitudes. However, they are only available infrequently and unlikely to give a complete picture across all asset markets.
See Holló, D., Kremer, M. and Lo Duca, M. (2012), “CISS – A composite indicator of systemic stress in the financial system”, Working Paper Series, No 1426, ECB. While the two indicators co-move positively, they are conceptually different. For instance, the CISS emphasises periods where stress is present across multiple market segments; it targets systemic risk, such as during the global financial crisis, which provides an indication of how widespread financial instability might be. However, this focus might interfere with the goal of a market sentiment indicator, which aims to assess how investors price risk. Accordingly, the two indicators can give different interpretations of the situation at times. As a case in point, during the early stages of the most recent tightening cycle in 2022, the CISS pointed towards a notable rise in stress driven by indicators targeting financial intermediaries. By contrast, sentiment indices like ours were impacted to a lesser extent, given the broader focus on financial markets.
See Bauer, M.D., Bernanke, B.S. and Milstein, E. (2023), “Risk Appetite and the Risk-Taking Channel of Monetary Policy”, Journal of Economic Perspectives, Vol. 37, No 1, pp. 77-100. This method also featured prominently in a recent article by the Deutsche Bundesbank; see “Risk appetite in financial markets and monetary policy”, Monthly Report, Deutsche Bundesbank, January 2025.
Multiple methods exist to measure market sentiment and risk appetite. For an overview, see the special feature entitled “Measuring investors’ risk appetite”, Financial Stability Review, ECB, June 2007. For more details on principal component analysis, see Jolliffe, I.T. (2002), Principal Component Analysis, Second Edition, Springer New York, NY.
Financial market variables included in the euro area risk appetite indicator: Euro Stoxx 50 Index, Euro Stoxx Banks Index, Euro-Bund Future Implied Volatility, Euro Stoxx 50 Implied Volatility (VSTOXX), Corporate Investment Grade Option-Adjusted Spread (OAS), Corporate High Yield Option-Adjusted Spread (OAS), Spread between 3-month Euribor and 3-month Overnight Index Swap (OIS), Spread between 10-year GDP-weighted Euro Area Government Bond Yield and 10-year German Government Bond Yield, USD/EUR Exchange Rate, CHF/EUR Exchange Rate.
The US index is replicated, except for Treasury yield volatility and an equity variance premium, from Bauer, M.D., Bernanke, B.S. and Milstein, E., op. cit.
Note that the risk appetite levels for the euro area and the United States are not comparable in absolute terms. This is because the composition of financial assets underlying the two indices is not identical and the levels shown reflect a statistical standardisation over the entire history of financial market movements in each case. Therefore, at a given point in time, a higher index level for the euro area than for the United States does not automatically mean that risk appetite in the euro area was higher. It only means that, relative to over two decades of financial history in the euro area, the relevant basket of euro area risk assets traded at more favourable levels than the relevant basket of US assets, in turn relative to over two decades of financial history in the United States.
See, for example, Jordà, Ò, Schularick, M., Taylor, A.M. and Ward, F. (2019), “Global Financial Cycles and Risk Premiums”, IMF Economic Review, Vol. 67, Issue 1, pp. 109-150.