Hours worked in the euro area
Published as part of the ECB Economic Bulletin, Issue 6/2021.
1 Introduction
This article analyses the evolution of hours worked per worker in the euro area, in the light of their relevance for the labour contribution to the production of goods and services and for the capacity of the labour market to adjust to macroeconomic developments.[1] First, it looks at the factors behind the trend decline in hours worked per worker over the last 25 years. It then goes on to consider the importance of hours worked per worker for labour market adjustment during economic expansions and recoveries. The long-term decline in hours worked per worker may affect labour input, depending on its interplay with labour market participation. Cyclical movements in hours worked per worker allow flexibility during downturns, as firms can adjust labour costs by reducing hours instead of employment (labour hoarding) in the event of adverse shocks to the profitability of the firms concerned. The contribution of average hours to the cyclical adjustment affects the measurement of labour market strength and slack. This is an important determinant of the dynamics of wage and price inflation, making it relevant for the conduct of monetary policy.
The decline in hours worked per worker is a long-term phenomenon. Annual hours worked per worker declined by more than a thousand hours in France, Germany, Italy and the Netherlands between 1870 and 1973.[2] Similar developments occurred in other countries, such as Australia, Canada, Japan, the United Kingdom and the United States. The pace of the decline decelerated somewhat after 1973 and became more uneven across countries. There are several reasons for the long-term decline in hours worked per worker, with technological progress as a common factor or even enabler.[3] In fact, technological progress over the last 150 years changed the nature of production work and led to the creation of large numbers of jobs in the services sector. Fast productivity gains allowed wages to increase and the cost of leisure activities to decrease, altering the optimal allocation of time between work and leisure. This article zooms in on the last 25 years for a detailed analysis of the evolution of hours worked per worker in the euro area.
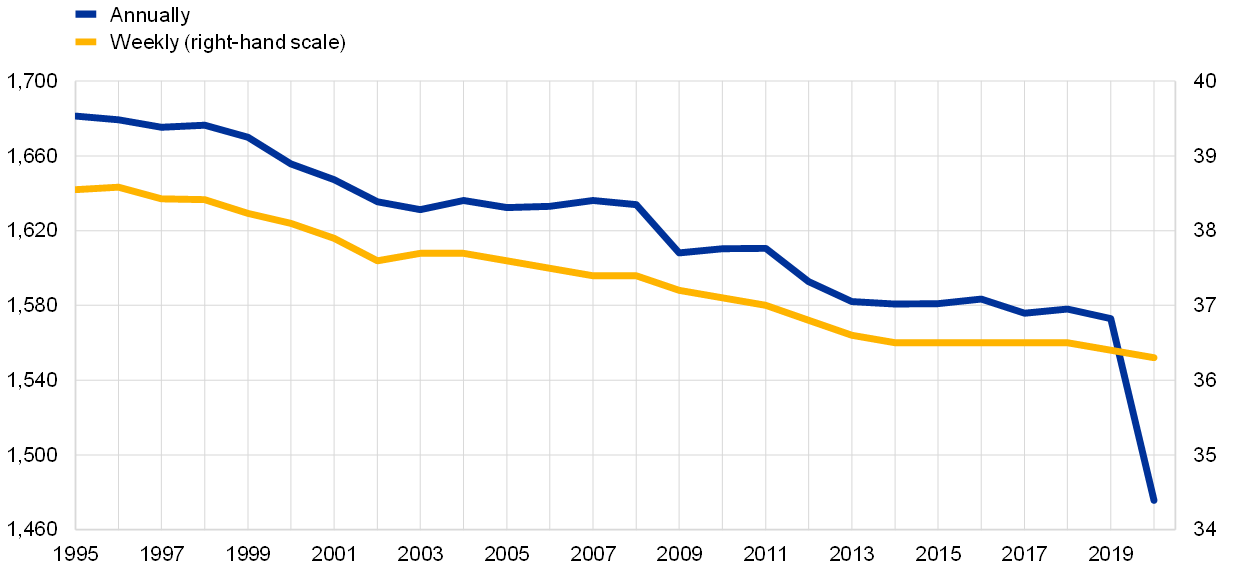
Between 1995 and 2019, annual hours worked per worker in the euro area declined by more than a hundred. On a weekly basis, hours worked per worker in the euro area fell from 38.6 in 1995 to 36.4 in 2019 (Chart 1). The decline in hours worked per worker was particularly large in 2020, on account of the coronavirus (COVID-19) pandemic, although most of this decline is expected to be only temporary. Moreover, while the pandemic affected the number of hours effectively worked in the euro area, it did not lead to significant changes in the usual duration of the work week for the average worker during 2020 compared to the period preceding the pandemic.
Chart 1
Hours worked per worker
(hours worked)
Source: Authors’ calculations based on Eurostat data.
Notes: See footnote 1 for the definition of the two measures of hours worked used in this chart. The discrepancy in the path of hours worked per worker between the two measures in 2020 may reflect the temporary impact of the COVID-19 pandemic on the euro area labour market. The latest observation is for 2020.
The decline in hours worked per worker in the euro area over the last 25 years is mainly associated with trends in labour force participation and part-time work. From a theoretical perspective, the reduction in hours worked per worker could reflect a reduction in hours worked in full-time or part-time jobs as well as an increase in the share of part-time work. The main factor behind the decline in hours worked per worker in the euro area over the last 25 years is an increase in the share of part-time work. From a household perspective, higher labour force participation increases aggregate income and may lead to lower average hours worked due to income effects, i.e. the income is higher with two members of the household working, who may decide to work fewer hours on average. At the same time, joint taxation systems may discourage the labour supply of second earners, leading to a higher likelihood of the second earner working part time.[4] Both the income effects and joint taxation systems may trigger lower hours worked per worker. Moreover, changes in regulations and workers’ preferences affect working time. For example, there were changes in working time regulations (e.g. the introduction of the 35-hour week in France in the early 2000s) coupled with preference shifts, with workers calling for a reduction of weekly hours worked instead of negotiating for higher wages.[5] The increase in labour force participation and in the share of part-time employment have mainly been driven by a higher female labour force participation rate, as women are also more likely to take up part-time jobs. The increase in female participation results in part from a shift in home production to the market economy (known as marketisation of home production), a phenomenon that is considered to have occurred later and to a more limited extent in Europe than in the United States.[6]
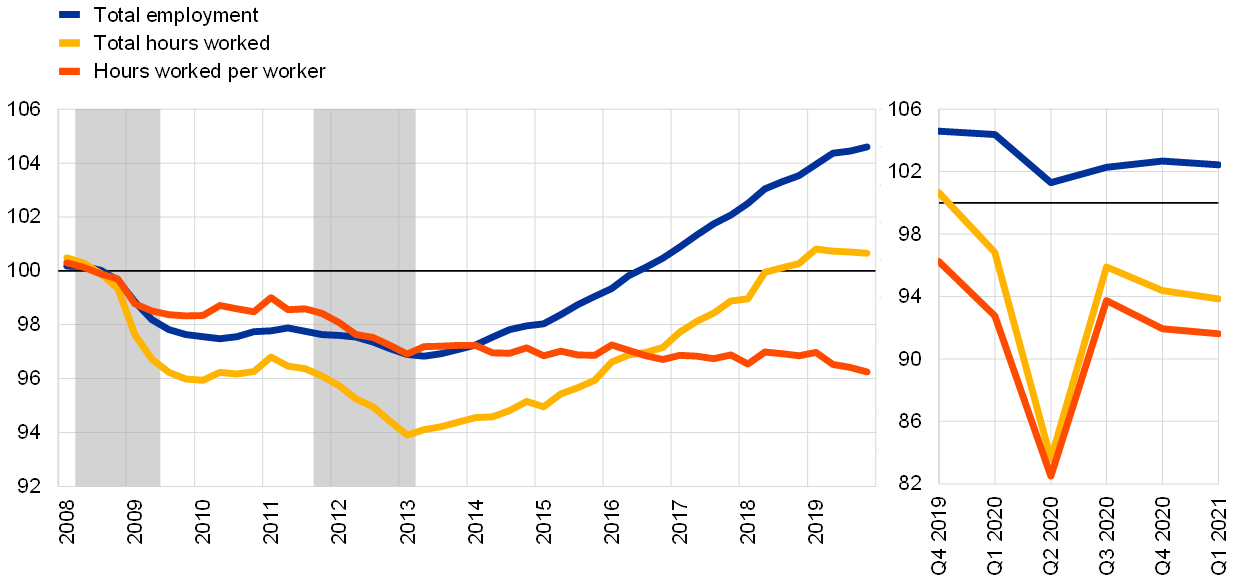
Developments in hours worked per worker are important to gauge the strength of the euro area labour market over the business cycle. The fallout from the global financial crisis and the euro area sovereign debt crisis has had a lasting effect on labour input as measured by total hours worked. During the crisis period, labour hoarding by reducing hours worked limited the increase in unemployment in the euro area. The adjustment in hours worked is an important part of any comprehensive analysis of the strength and timing of labour market recoveries, as the unemployment rate may not fully reflect the state of the labour market. For example, the number of hours worked per worker became even more important for the capacity of the labour market to adjust to the COVID-19 pandemic, as euro area countries deployed job retention schemes to protect employment (Chart 2).[7]
Chart 2
Hours worked and employment since the global financial crisis
(index, 2008=100)
Source: Authors’ calculations based on Eurostat data.
Notes: The shaded areas in the left panel represent recessions in the euro area as defined by the Euro Area Business Cycle Dating Committee. The latest observations are for the fourth quarter of 2019 in the left panel and the first quarter of 2021 in the right panel.
2 Long-term developments in hours worked
Structural changes over the last 25 years have had a considerable impact on hours worked per worker. These transformations include a larger share of employment in the services sector, greater female labour force participation, an increased share of part-time work and an ageing society.[8] The increase in labour market participation contributed to higher total hours worked and higher hours worked per capita.[9] However, to the extent that new labour market entrants worked fewer hours, they contributed to a decrease in hours worked per worker. This section analyses developments in hours worked per worker in the euro area in the last 25 years. It concludes that the main driver of the decline is higher labour market participation by women, which is also reflected in an increased employment-to-population ratio.
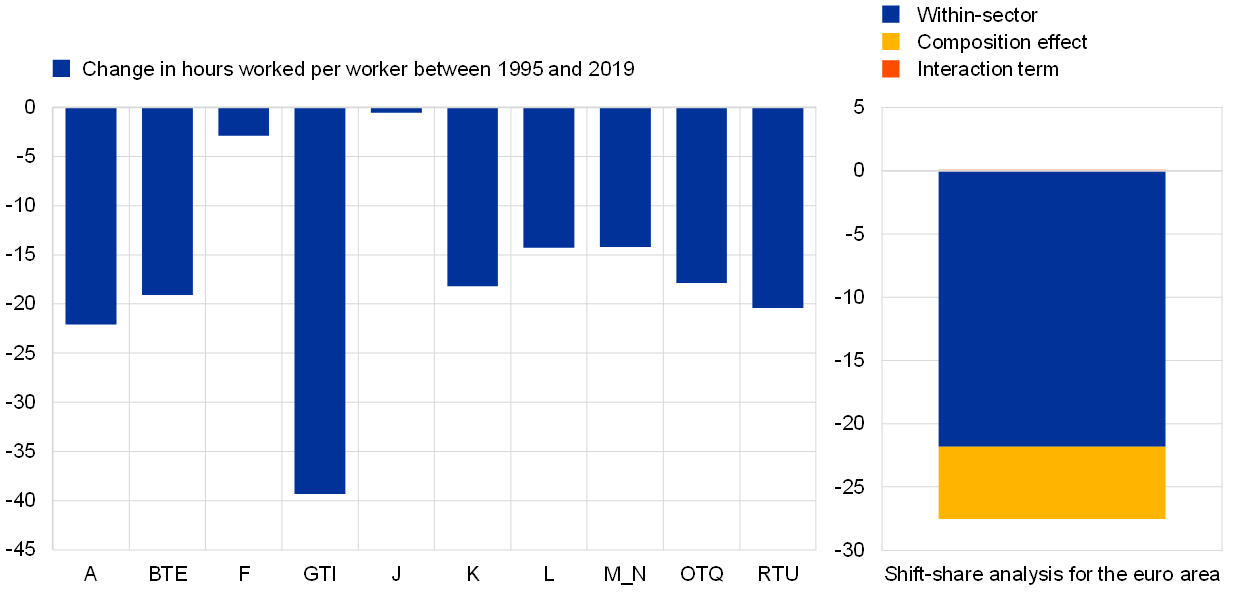
Hours worked per worker declined across all sectors, while shifts towards services put further downward pressure on this metric. A shift-share analysis shows that most of the secular decline in average hours worked in the euro area is driven by within-sector dynamics, as average hours worked declined in most sectors. However, composition effects also play a role, accounting for roughly 20% of the decline in hours worked per worker in the euro area since 1995 (Chart 3). These composition effects are driven by a decline in the employment share of agriculture and industry and a corresponding increase in the employment share of professional services and administrative and support activities. The shift from manufacturing to services is often labelled as the “servitisation” of the economy, with manufacturing firms changing their business models to start selling both goods and services.[10] More broadly, sectoral differences in hours worked per worker are also related to technological differences across the different sectors and to the different conditions offered by employers across sectors. The technological channel implies differences in hours worked per worker across sectors resulting from differences in the production methods used at the firm level in different sectors. The different conditions offered by employers across sectors is driven instead by changes in labour demand and in the bargaining power of workers as they negotiate their labour contracts.
Chart 3
Decline in hours worked per worker at the sectoral level – shift-share analysis
(hours worked)
Source: Authors’ calculations based on Eurostat data.
Notes: A – agriculture, BTE – industry, F – construction, GTI – wholesale and retail trade, J – information and communication technologies, K – financial activities, L – real estate, M_N – professional services and administrative and support activities, OTQ – public services, including health and education, RTU – other services, including recreation and personal services. The interaction term is positive but very small and thus barely visible in the chart.
The decline in hours worked per worker in the euro area was accompanied by a corresponding increase in the employment-to-population ratio. Chart 4 (panel a) compares the employment-to-population ratio with the quarterly hours worked per worker in the euro area. It shows that in the last 25 years, the significant decline in hours worked was accompanied by higher labour market participation (about 8 percentage points), hinting at a substitution effect in the labour market as more people started participating with fewer hours. Taken together, the increase in the employment-to-population ratio and the decline in average hours worked also suggest the existence of income effects and long-term changes in labour supply decisions taken by households in the euro area. Such substitutability between average hours worked and labour market participation is a feature peculiar to the euro area as this is not present in the data for the United States in this period. In the United States, employment and hours worked per worker tend to co-move and depend mostly on business cycle conditions (Chart 4, panel b).[11] Also, the reduction in hours worked per worker during the last 25 years was smaller in the United States than in the euro area. Such differences highlight the importance of careful analysis of hours worked per worker when assessing the euro area labour market.
Chart 4
Quarterly hours worked per worker and employment-to-population ratio
(left-hand scale: quarterly hours worked per worker; right-hand scale: percentages)

Source: Authors’ calculations based on Eurostat data.
The largest euro area countries share a secular decline in hours worked per worker, although the level of hours worked varies and is negatively related to the employment-to-population ratio. Chart 5 shows that countries with relatively fewer hours worked per worker have a relatively higher employment-to-population ratio (e.g. Germany), while countries with higher levels of quarterly hours worked per worker have lower employment-to-population ratios (e.g. Italy and Spain). Beyond differences in the level of average hours worked and employment-to-population ratios, both variables face a common trend across countries. Larger declines in average hours tend to be associated with larger increases in employment-to-population ratios. France, Germany and Italy contributed the bulk of the decline in average hours worked in the euro area (around 78%) over the last 25 years.
Chart 5
Quarterly hours worked per worker and employment-to-population ratio in the four largest euro area countries
(left-hand scale: quarterly hours worked per worker; right-hand scale: percentages)

Source: Authors’ calculations based on Eurostat data.
Note: The latest observation is for the fourth quarter of 2019.
The higher labour market participation of women is the main driver behind the increase in the employment-to-population ratio in the euro area. The euro area labour force participation rate was 59.8% in 2000, rising to 64.6% in 2019.[12] The increase in labour force participation in the euro area was mostly driven by more women participating in the labour market, with the rate increasing by around 9 percentage points over the last two decades to reach 59.4% in 2019. Thus, increased female participation contributed 90% of the increase in labour force participation in the euro area between 2000 and 2019.[13]
The increase in female labour force participation is also associated with an increase in part-time employment.[14] Women are more likely to work part-time than men.[15] In the euro area, women make up a disproportionate share of part-time workers, accounting for more than 75% of part-time employment. 29% of employed women and 5% of employed men worked part-time in 2000, rising to 36% of employed women and 10% of employed men in 2019. Most part-time employment is voluntary and allows for more people to participate in the labour market at any given point in time (see also Chart 16 in Section 3).[16] Yet some institutional features, such as insufficient childcare arrangements, may hamper the ability of some people to work full time.
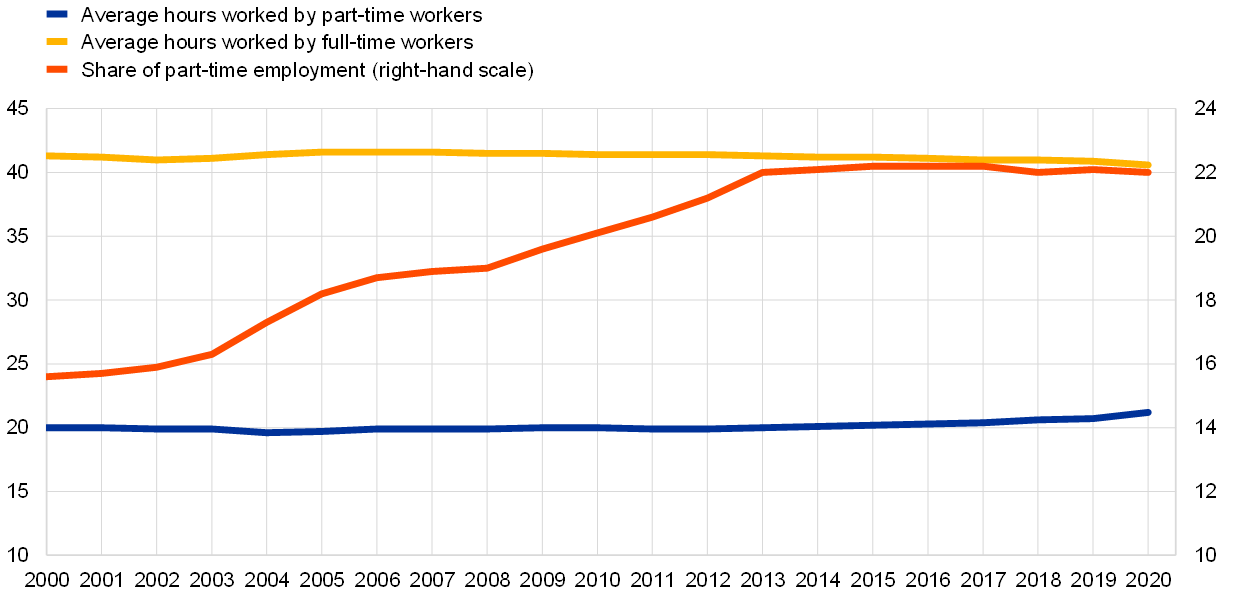
The increase in part-time employment is the main factor behind the decline in hours worked per worker. Conceptually, hours worked per worker can decrease either when full-time or part-time workers work fewer hours or when there is an increase in the share of part-time work in the economy. Over the last two decades, the average full-time worker in the euro area saw their average hours worked fall by about half an hour per week, while the average part-time worker saw their average hours worked increase by slightly more than half an hour per week (Chart 6, panel a).[17] These developments did not contribute much to the decline in average hours worked in the euro area. By contrast, the euro area has faced a remarkable increase in part-time work, with the share of part-time employment in the euro area rising from 15.4% in 2000 to 22.1% in 2019.[18] While workers are traditionally more likely to work part-time in some countries (such as Germany or the Netherlands) than in others (such as Italy or Spain), the increase in part-time employment is common to all the larger euro area countries (Chart 6, panel b).[19]
Chart 6
Relation between average hours worked and part-time employment
a) Average hours worked by part-time and full-time workers, and share of part-time employment
(left-hand scale: hours per week; right-hand scale: percentages)
b) Average hours worked and part-time employment – cumulative change from 2000
(percentages)
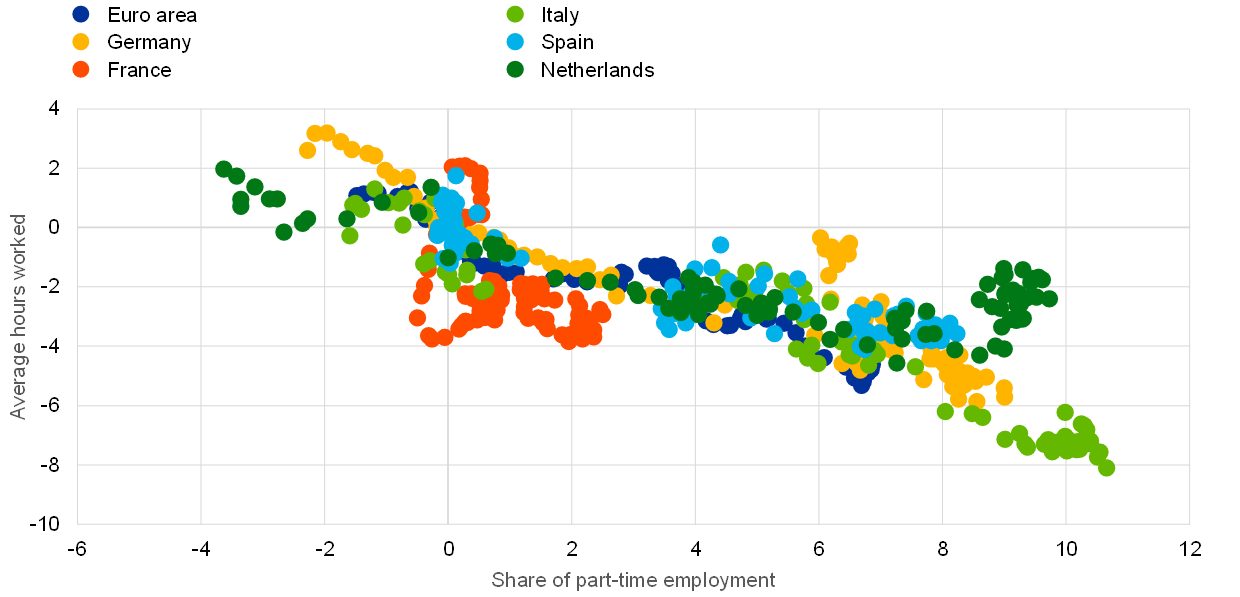
Source: Authors’ calculations based on Eurostat data.
Notes: Panel a): hours worked for full-time and part-time workers measured as usual weekly hours worked, as recorded in the EU-LFS. Panel b): the chart comprises changes in part-time employment and average hours worked compared with their average values in 2000, with average hours worked taken from the Eurostat national accounts data. The sample in panel b comprises the period between the first quarter of 1997 and the fourth quarter of 2019, and changes are measured with respect to the average in 2000 for consistency with the data presented in panel a, which is only available from 2000 onwards. Part-time employment is calculated as a share of total employment, and average hours worked are at quarterly frequency.
The negative relationship between hours worked per worker and part-time employment is a long-term feature of the euro area labour market. The growth rate of average hours worked is lower as part-time employment increases during both expansions and recessions. However, this relation is asymmetric with the business cycle, with changes in part-time employment having a stronger impact on the growth of average hours worked during recessions than during expansions. Table 1 proposes a set of reduced-form regressions quantifying the negative relationship between average hours worked and the share of part-time employment. To account for cross-sectoral variability across countries, panel data across all euro area countries are used to estimate the relationship between the year-on-year growth rate of average hours worked and the year-on-year changes in the share of part-time employment. An increase of one percentage point in the share of part-time employment serves to slow year-on-year growth in average hours worked by 0.12 percentage points during expansions and by 0.57 percentage points during recessions.[20] The cyclical conditions of the labour market are also an important factor contributing to the dynamics of average hours worked. Year-on-year changes in the unemployment rate also have an impact on the growth rate of average hours worked asymmetrically with the business cycles. During expansions, decreases in the unemployment rate lead to a higher growth rate of average hours worked.[21] By contrast, increases in the unemployment rate during recessions also lead to increases in the growth rate of average hours worked, as workers who work fewer hours are usually laid off first. This implies that the dynamics of average hours worked also have an important cyclical component on top of the declining long-run trend.
Table 1
Quantifying the relation between average hours worked and part-time employment
(dependent variable: year-on-year growth rate of average hours worked, percentages)

Sources: Eurostat, EU-LFS and ECB staff calculations.
Notes: ** and *** refer to statistical significance at 5% and 1% respectively. Each regression model estimates the relationship between the year-on-year growth rate of average hours worked and the year-on-year percentage point differences in the share of part-time employment (PT), defined as the ratio between part-time employment and total employment. Model (1) estimates this relation using time series data for the euro area as a whole, while model (2) estimates the same relation using panel data for the 19 euro area countries. Model (3) accounts for the state of the business cycle by augmenting the regression in (2) with each country’s unemployment rate. Model (4) introduces additional country fixed effects. Finally, model (5) includes a dummy for the euro area recessions as communicated by the Euro Area Business Cycle Dating Committee and allows for asymmetric effects of part-time employment and the unemployment rate to the growth rate of average hours worked during expansions and recessions. The panel data regressions in models (2) to (5) are weighted by the employment share of each country. The sample period is from the first quarter of 1995 to the fourth quarter of 2019.
The documented decline in hours worked per worker depends on both demand and supply factors. Most people working part-time do so voluntarily, as they choose to work fewer hours than full-time workers. However, a not insignificant share of part-time workers report doing so because they could not find a full-time job, suggesting that demand is a factor determining the numbers of hours worked. The EU-LFS asks all workers whether they would like to work more hours. In the total sample, about 10% of workers report that they would like to work more hours than they currently do (Chart 7). Among part-time workers, more than one in five would like to work more hours than they usually do.
Chart 7
Share of workers who would like to work more hours
(percentages)
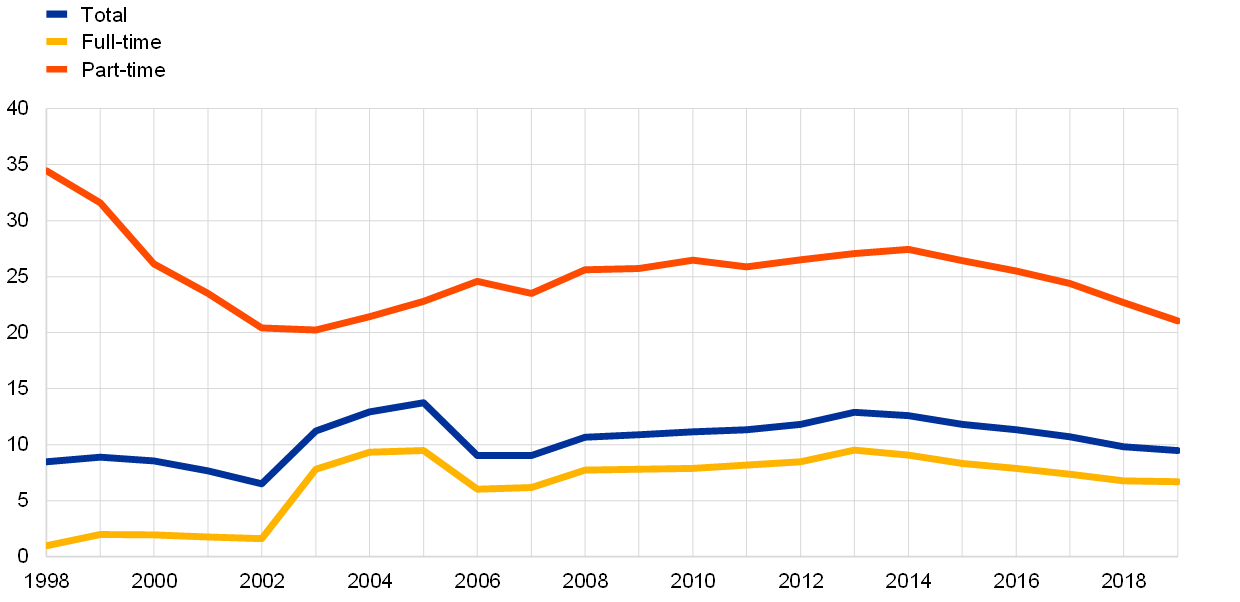
Source: Authors’ calculations based on Eurostat data.
Part-time employment features a cyclical component related to “involuntary” part-time employment, which acts as a buffer in the adjustment of the labour market during crisis periods. Chart 8 shows the evolution of part-time employment in the euro area between 2006 and 2019, focusing on disentangling the trend increase in “voluntary” part-time employment from the more cyclical “involuntary” part-time employment. “Voluntary” part-time employment reflects increases in the aggregate labour supply stemming from increasing flexibility in the labour market, which allows workers to work if they wish and to work fewer hours than a full-time job. By contrast, “involuntary” part-time employment comprises all workers who work part-time because they could not find a full-time job. In this way, involuntary part-time captures fluctuations in labour demand, in workers’ bargaining power and in the matching efficiency of the euro area labour market. This all means that involuntary part-time employment is considerably more cyclical than voluntary part-time employment. Voluntary part-time employment has been trending upwards over time, without many major cyclical fluctuations. At the same time, involuntary part-time employment in the euro area increased during the global financial crisis and the sovereign debt crisis periods, before falling slowly during the economic expansion that ensued following a stabilisation during the first years of the recovery.[22] The share of involuntary part-time work can also be linked to labour underutilisation beyond that captured by the unemployment rate, with this factor instead being observed in a decline in average hours worked.
Chart 8
Part-time employment: voluntary vs involuntary
(percentage of the number of persons employed)
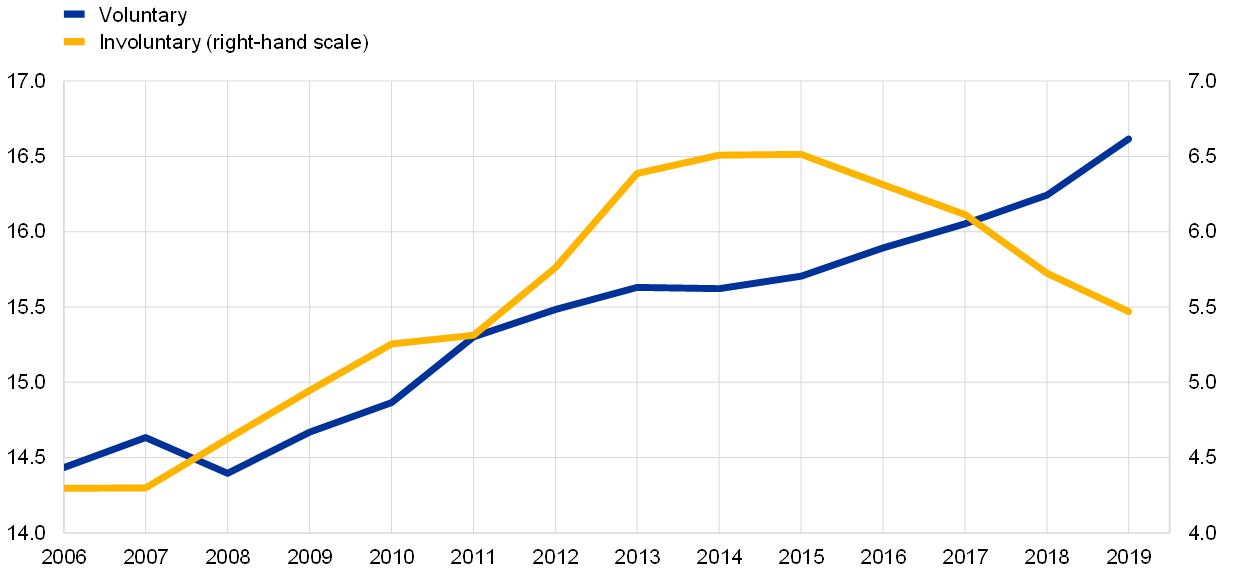
Sources: Eurostat and ECB staff calculations.
Note: The latest observation is for 2019.
The differences in hours worked per worker across demographic groups are largest for women. To analyse differences across individuals, hours per week usually worked are regressed on five age groups, three education groups, gender, occupation, economic activity sector, country and year. The regression analysis is carried out for the period 1998-2019 using the EU-LFS microdata for workers aged 20-65 reporting between ten and 60 hours usually worked per week; the agriculture sector and armed forces are excluded. Chart 9 displays the estimation results for individual characteristics. It shows that the more marked differences in weekly hours worked occur for gender, with usual hours worked per week being about five hours fewer for women than for men. This result is partly explained by the larger share of women working part-time. All age groups work higher hours on average than the 20-24 age group. Among prime-age workers, the 35-44 age group reports slightly lower hours, which may be related to childcare activities. Across education groups, workers with high levels of education tend to work more hours than workers with middle and low levels. These are average results for 1998-2019; the patterns are relatively stable over this period for gender but differ for both age and education. The 20-24 age group saw a larger decline in hours worked than any other age group; and workers with a high level of education had a smaller decline in hours worked than workers with low and middle levels of education.
Chart 9
Differences in weekly hours worked by demographic group
(weekly hours in differences from the base category: age 20-24 for age groups, low education for education levels; and male for gender)
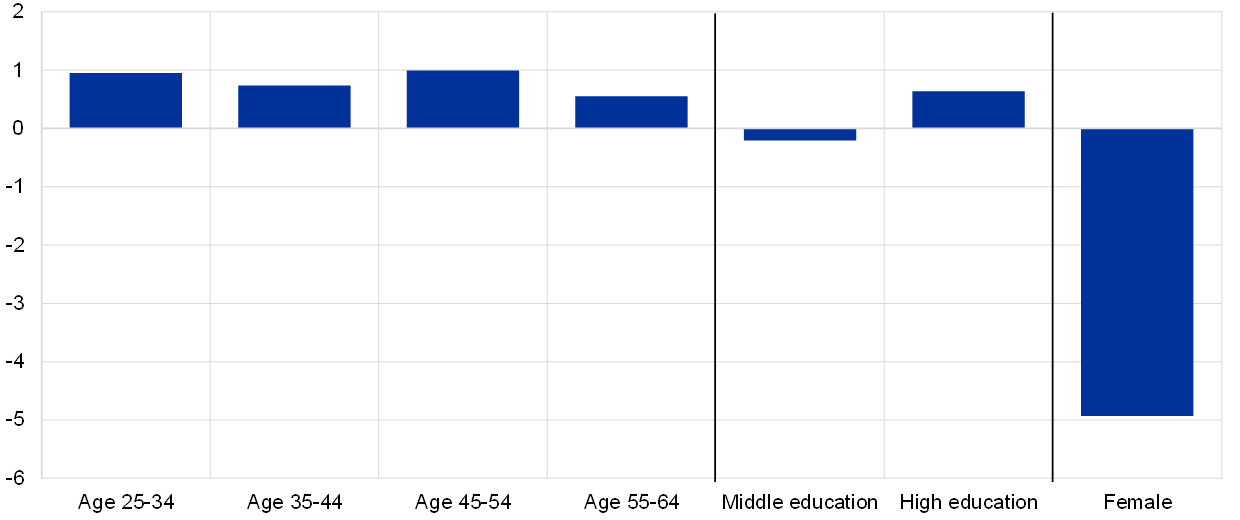
Source: Authors’ calculations based on Eurostat data.
Notes: Results based on a regression framework with usual hours worked per week as dependent variable and age, education, gender, occupation, sector, country and year as explanatory variables. Estimates statistically significant at 1% level.
The incidence of part-time work varies across demographic groups and activity sectors, and these differences may offer insights on the future evolution of hours worked per worker. Female and older workers have been two important forces driving the increase in labour force participation in the euro area. It is expected that these two groups will continue to increase their share in the labour market, in view of the large heterogeneity in their labour force participation rates across the euro area countries and the ageing of the population. These developments are likely to continue to contribute to lower hours worked per worker as these workers are more likely to work part-time. [23] In addition, the incidence of part-time varies greatly across economic activity sectors. For example, accommodation, healthcare and social activities, and education are three sectors where the incidence of part-time work is above average and which have also gained employment shares since the global financial crisis. An increase in employment in sectors with higher shares of part-time work may lead to lower average hours worked per worker in the future. The skill level is another factor explaining the incidence of part-time work. Part-time work increased across all education groups, with faster increases for low- and middle-skilled workers than for high-skilled workers, from about 16% in 2000 to 24% in 2020. In the same period, part-time employment among high-skilled workers increased from 13% to 18%. The increasing employment share of high-skilled workers may moderate the downward pressure on hours worked per worker.
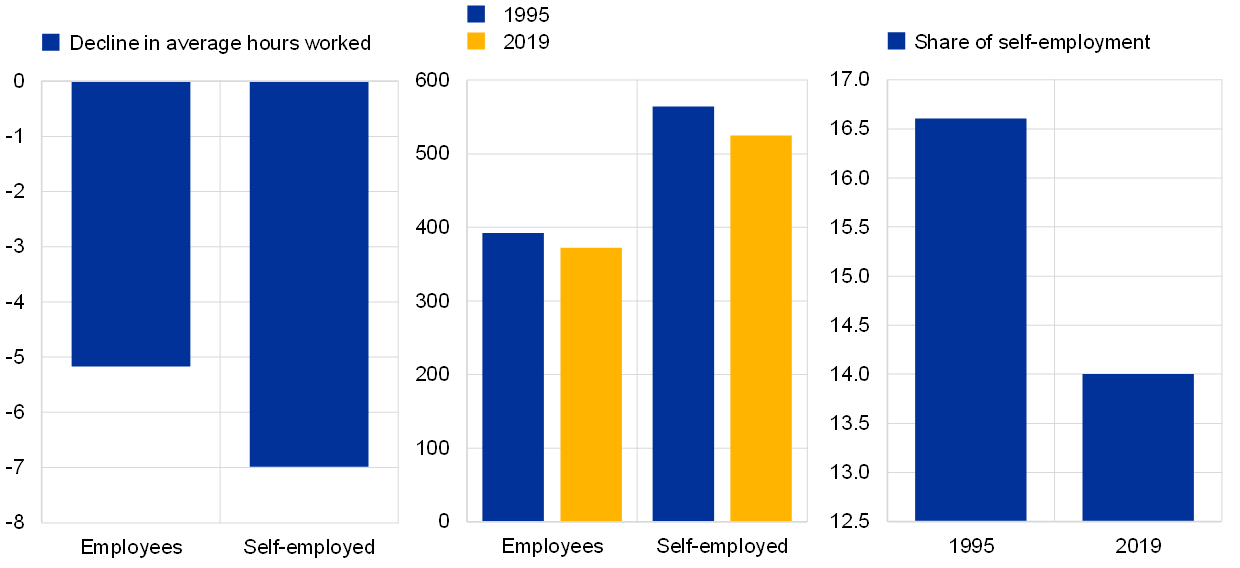
Self-employment is another important factor driving the decline in average hours worked in the euro area. Self-employment contributes to the decline in average hours worked directly – with the average self-employed worker decreasing their hours worked by more than the average employee – and indirectly via composition effects in the economy.[24] The direct effects can be assessed by looking at the relative decline in average hours worked across the two groups of workers. While employees reduced their average hours worked by 5.2% between 1995 and 2019, the average self-employed worker reduced their hours by 7% over the same period (Chart 10, left panel). The indirect contribution of self-employment to the decline in average hours worked stems from composition effects, as self-employed workers worked longer hours on average than the average employee (Chart 10, middle panel) and their share in total employment decreased (Chart 10, right panel).
Chart 10
Employment share and average self-employed hours worked
(left panel: percentages, middle panel: quarterly hours worked; right panel: percentages)
Source: Authors’ calculations based on Eurostat data.
Note: The left panel shows the percentage decline in average hours worked by employees and self-employed workers between 1995 and 2019; the middle panel considers the average hours worked by employees and self-employed workers in 1995 and 2019; and the right panel depicts the employment share of self-employment in the euro area in 1995 and 2019.
Box 1
Implications of the declining trend in hours worked per worker for potential output
This box examines how changes in trend hours worked per worker have affected euro area potential output growth. Total labour input is defined in terms of total trend hours worked and can be further decomposed into different components such as the size of the working age population, the trend labour force participation rate, the trend unemployment rate (NAIRU) and trend hours worked per worker.
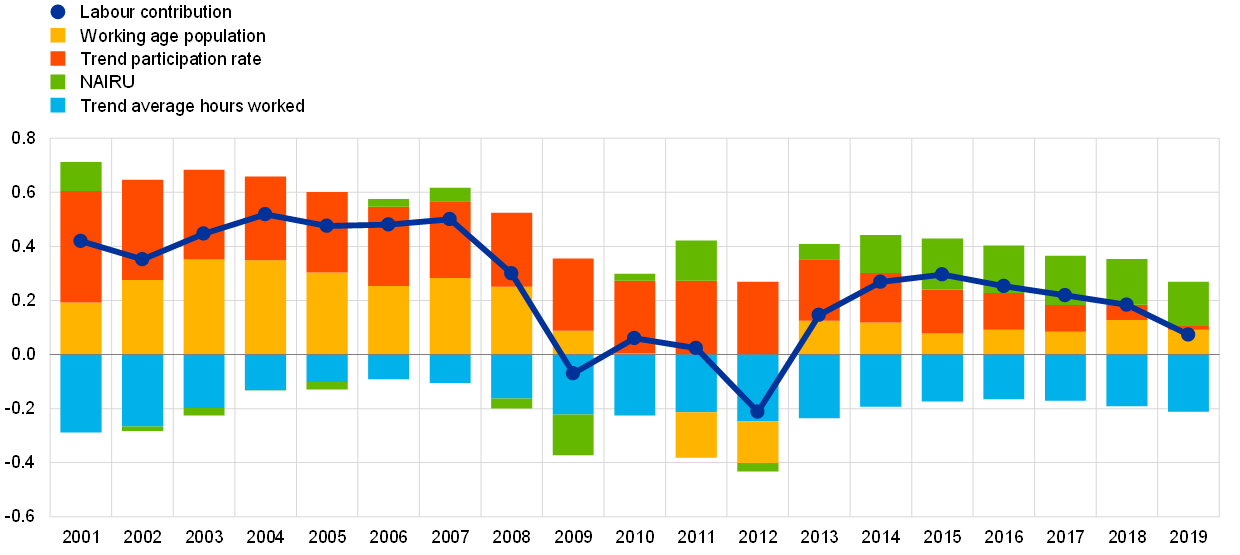
The labour contribution to potential output in the euro area has decreased over time. According to estimates from the European Commission, the labour contribution was around 0.4-0.5 percentage points before the global financial crisis and slowed down to 0.1 percentage points by 2019. This reflects a slowdown in the growth rate of the working age population, while trend hours worked per worker has provided a negative contribution. This has been partially offset by a positive contribution from the rising trend labour force participation rate and the declining NAIRU.
The growth in trend average hours worked has been negative over recent years, averaging -0.3% per year between 2001 and 2019. The decline in trend average hours worked led to an estimated contribution of less than -0.2 percentage points to the annual growth rate of potential output (Chart A). Put in perspective, this is a relatively small and somewhat constant contribution to the annual growth rate of potential output which, according to the European Commission, increased by an average of around 1.8% between 2001 and 2008 and around 0.6% between 2009 and 2012, before improving to around 1% thereafter.[25] However, it is not negligible as a driver of the labour input contribution to potential output growth.
Chart A
Labour contribution to potential output growth and its components in the euro area
(percentage point contributions)
Source: European Commission.
The declining trend in average hours worked has been accompanied by an increase in the trend labour force participation rate. This is not merely a co-movement, but the two indicators are related. The rise in the trend labour force participation rate is instead driven by women and older people being more involved in the labour market. The increase in the trend labour force participation rate has offset the negative contribution from trend hours worked per worker, albeit with differences over time.[26] Developments in trend hours worked per worker and labour force participation also relate to the slowing growth of the working age population. The ageing of the euro area population results in an increasing share of pensioners and a worsening of the old-age dependency ratio. This has incentivised governments to introduce pension reforms that have been the main driver of the rise in the labour force participation rate[27] and also contributed to the decline in trend hours worked per worker.
Furthermore, the trend decline in hours worked per worker can also influence total factor productivity, in a relation that is not necessarily linear. Lower hours worked may lead to higher productivity, because employee fatigue, which was found to decrease marginal productivity, appears less.[28] But employing a worker implies some fixed costs, for example in terms of training and providing office equipment. Such fixed costs are relatively higher for those whose working hours are lower, resulting in lower measured productivity. However, these effects are difficult to estimate as characteristics of industries, firms, jobs and individuals may also play an influential role in the evolution of both productivity and hours worked.
The impact of the COVID-19 shock on trend hours worked per worker is still uncertain. During the pandemic, the adjustments on the labour market occurred mainly through the intensive margin, which has taken a particularly heavy toll. In that context, disentangling trends in hours worked per worker and cycles may be challenging.[29] Furthermore, the future path of trend hours worked per worker will also crucially depend on how the crisis affects the trend participation rate of women and older people in the labour force, and how teleworking impacts trend hours worked per worker.
3 Hours worked during the pandemic
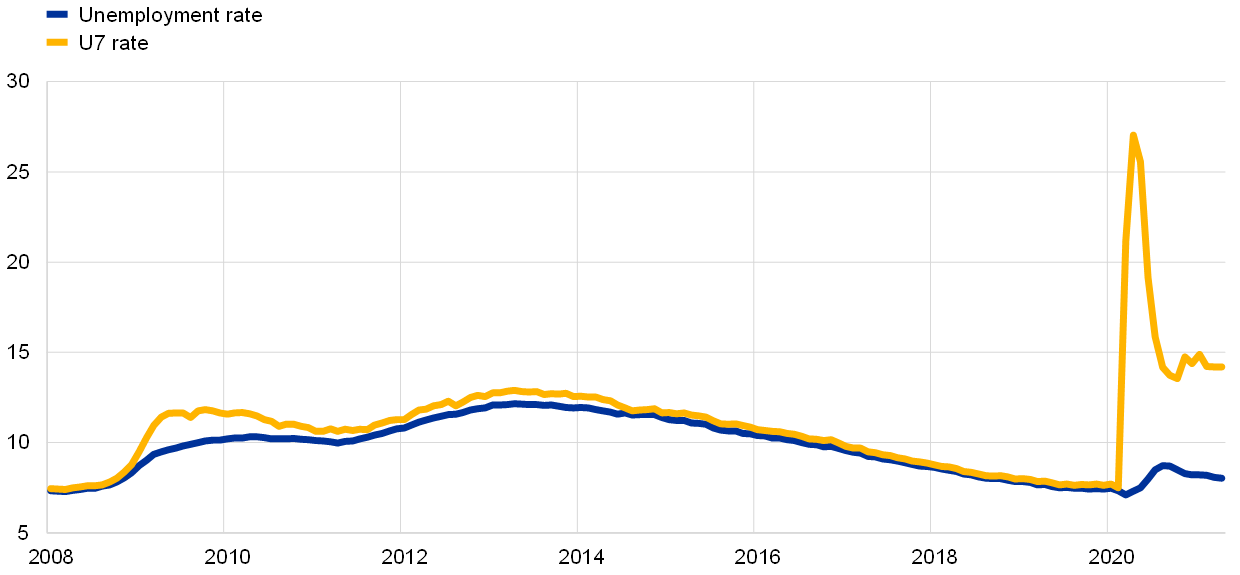
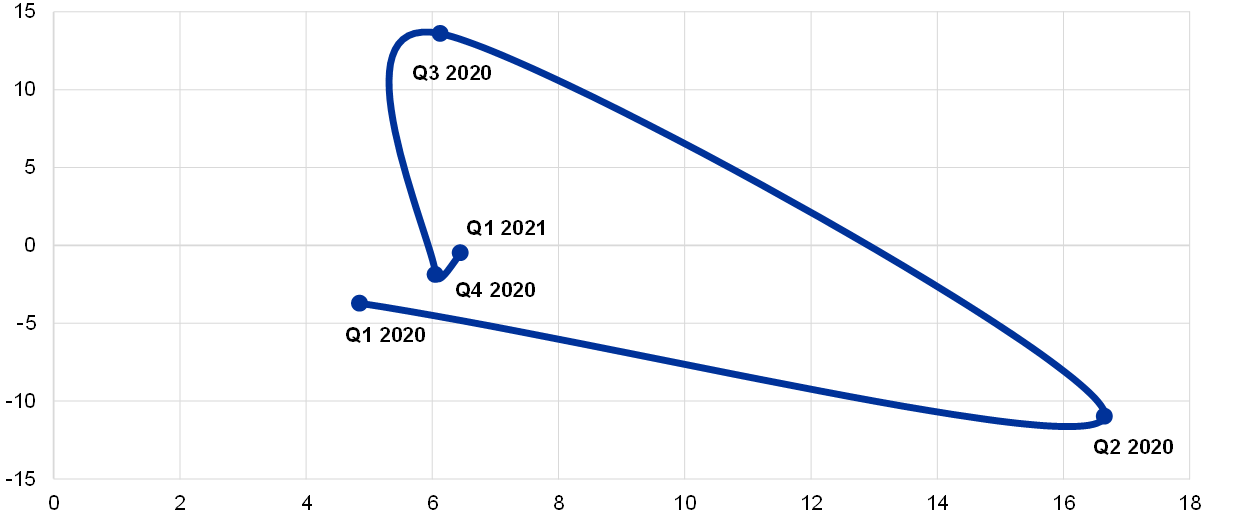
The adjustment of the labour market during the COVID-19 pandemic featured only limited changes in the standard unemployment rate. Measures to contain the spread of the coronavirus severely limited activity in some sectors. This situation would normally lead to a sharp increase in unemployment. However, policy support in the form of job retention schemes helped to protect employment and facilitated labour market adjustment via average hours worked (Chart 11). This led the standard measure of the unemployment rate to be mostly unaffected during the pandemic. However, a broader measure of labour underutilisation, the “U7” rate, can account for both people unemployed and workers in job retention schemes. The U7 rate thus better captures the strong response of the labour market to the sharp contraction in economic activity during the pandemic (Chart 12).[30]
Chart 11
Unemployment rate and U7 rate
(percentage of the labour force)
Sources: Authors’ estimates based on data from Eurostat, Institute for Employment Research, ifo Institute, French Ministry of Labour, Employment and Economic Inclusion, Italian National Institute for Social Security and Spanish Ministry of Inclusion, Social Security and Migration.
Notes: The U7 rate is defined as the unemployment rate augmented by the workers in job retention schemes as a percentage of the labour force. Workers in job retention schemes are considered employed during the period analysed and thus part of the labour force. The latest observation is for April 2021.
Chart 12
Average hours worked and job retention schemes
(y-axis: percentage variation in hours worked per worker; x-axis: workers in job retention schemes as a share of total employment)
Sources: Authors’ estimates based on data from Eurostat, Institute for Employment, ifo Institute, French Ministry of Labour, Employment and Economic Inclusion, Italian National Institute for Social Security and Spanish Ministry of Inclusion, Social Security and Migration.
Hours worked per worker played an important role in the adjustment of the labour market during the pandemic. The year-on-year growth rate of real GDP can be decomposed into developments in total hours worked and labour productivity per hour worked. The developments in total hours worked are further decomposed in Chart 13 to account for the different margins of adjustment in the labour market, such as changes in average hours worked, the unemployment rate, labour force participation and population growth. These different margins can have either a persistent or a cyclical impact on the growth rate of total hours worked. Of these factors, changes in hours worked per worker represent on average a persistent drag on the growth rate of real GDP over time, which is stronger during recessions and milder during expansions. The importance of hours worked per worker increased considerably during the pandemic, boosted by the strong policy support in the form of job retention schemes.
Chart 13
Labour market decomposition of real GDP growth
(year-on-year growth, percentages)
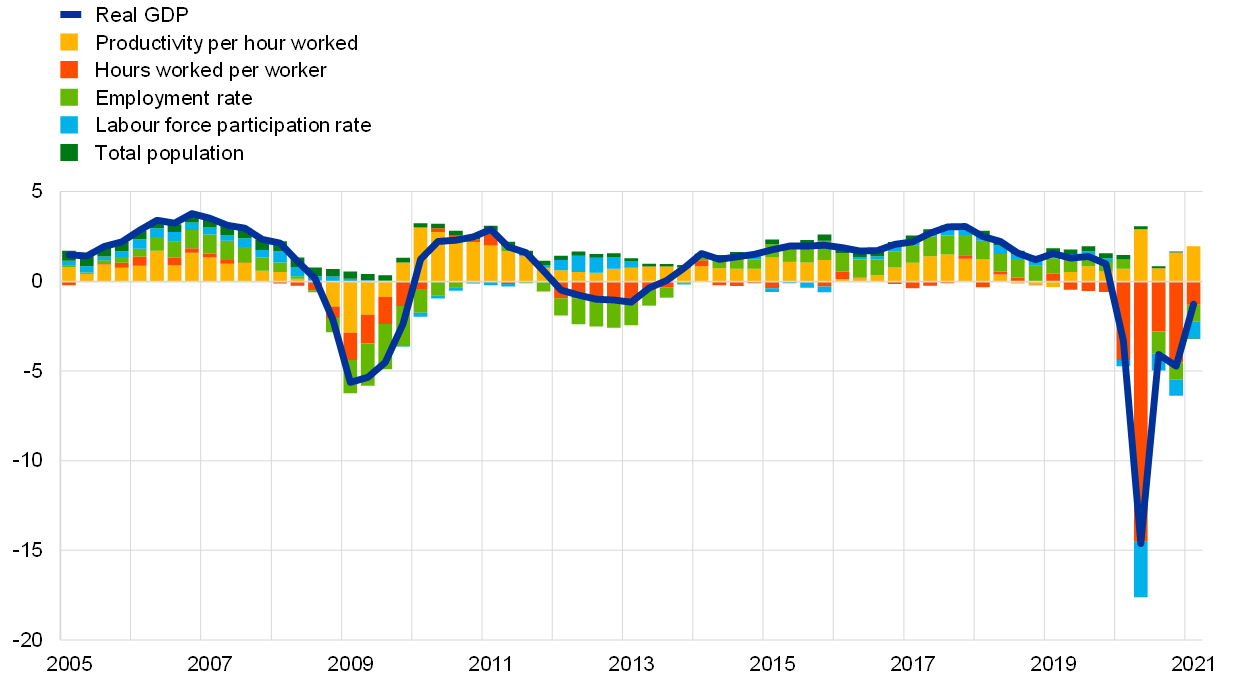
Sources: Eurostat and ECB staff calculations.
Notes: Real GDP is decomposed into labour productivity (real GDP/total hours worked), hours worked per worker, employment rate (total employment/total labour force), labour force participation rate (total labour force/total population) and total population. The labour force is defined as the sum of employed and unemployed workers. The contribution of total hours worked to the growth rate of real GDP can be obtained by adding together the contributions of average hours worked, employment rate, labour force participation and total population. The latest observation is for the first quarter of 2021.
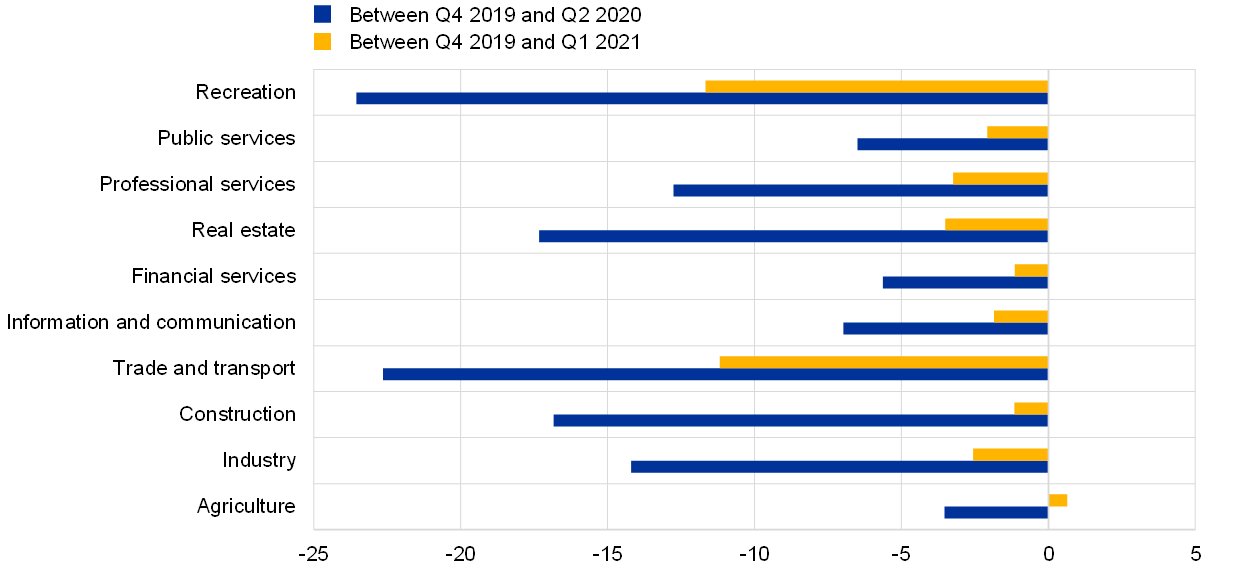
The adjustment in hours worked per worker varied greatly across sectors, reflecting the nature of the pandemic and subsequent containment measures. In the first half of 2020, average hours worked declined by 14.3%. The decline was much stronger in contact-intensive sectors such as trade and transport and recreation – which also saw their activity substantially curtailed due to social distancing measures – than for sectors such as ICT or financial services, which are less contact-intensive and have a higher proportion of potentially teleworkable jobs (Chart 14).[31] Average hours worked recovered substantially from the lows recorded in the second quarter of 2020. That said, average hours worked were still 5% lower in the first quarter of 2021 than in the last quarter of 2019. The trade and transport and recreation sectors remain the worst affected by the pandemic, with average hours worked in the first quarter of 2021 standing 11% below the levels seen in the fourth quarter of 2019.
Chart 14
Variation in hours worked per worker by sector
(percentages)
Source: Authors’ calculations based on Eurostat data.
Job retention schemes facilitated the preservation of employment in these sectors.[32] A great advantage of these schemes is that they help activity to resume swiftly as soon as containment measures are lifted. However, they need to be flexible enough to be adjusted quickly as soon as activity recovers so as to allow labour reallocation across firms.
4 Concluding remarks
The analysis of hours worked per worker plays an important role in explaining both the long-term trends and the cyclical fluctuations in the euro area labour market. A secular downward trend in hours worked per worker is mainly related to technological progress, sectoral shifts towards the services sector, changes in labour and tax regulations, increases in labour force participation and the increased preference for part-time jobs. At the same time, cyclical changes in hours worked per worker have provided an important margin of labour market flexibility to withstand adverse shocks to firms’ profitability during the global financial crisis, the euro area sovereign debt crisis and the COVID-19 pandemic.
Various factors help to explain the decline in hours worked per worker over the last 25 years, while the future path after the pandemic is uncertain. Increases in self-employment and in the participation rate of women and the related increase in part-time employment explain some of the decline in hours worked per worker over the last 25 years. While hours worked per worker played a prominent role as a margin of adjustment during the pandemic, it remains unclear whether hours worked will recover to pre-pandemic levels.
The cyclical adjustment of hours worked per worker is a distinct feature of the euro area, making it important for assessing the labour market. The use of part-time contracts and, more recently, the widespread use of job retention schemes mean that the standard measure of unemployment is not fully capable of capturing labour underutilisation in the euro area. Consequently, any analysis of the labour market needs to include the intensive margin. Hours worked and the share of (involuntary) part-time employment are thus important metrics to complement standard labour market indicators. Moreover, hours worked per worker in the euro area tend to decline faster during cyclical downturns and then not fully recover during the upturn. Real-time analysis has become more difficult and uncertain as different permanent and cyclical factors are at play in the dynamics of hours worked per worker, which can blur potential scarring effects from recessions.
Labour market heterogeneity measured in terms of full-time and part-time workers is an important factor affecting the Phillips curve. When looking at the wage-unemployment relationship in the euro area, Eser et al.[33] conclude that the sensitivity of wages to the output gap can be lower to the extent that there are many people underemployed or inactive. Thus, assessing the intensive margin and considering differences across job types may provide a better signal of the strength of the labour market as well as the implications for wages and inflation. In addition, labour market heterogeneity is relevant for income inequality. This is especially the case when either average hours worked or part-time workers are more persistently affected following an economic recession. Hysteresis effects on hours worked can further contribute to a higher income dispersion across workers, as also suggested by Heathcote et al.[34] for the United States.
The future path in hours worked per worker is difficult to predict, while the balance of factors seems to point towards the downward trend continuing. The expected increase in labour market participation of female and older workers is likely to exert downward pressure on hours worked per worker. A higher employment share in the services sector with higher rates of part-time employment may also lead to lower average hours worked. By contrast, the ongoing upskilling of the labour force may moderate the decline in hours worked per worker, as individuals with higher education levels tend to work more hours on average. Preferences regarding the allocation of time will continue to play a key role on the evolution of hours worked.
- Two main data sources for hours worked per worker are used throughout the article. The first is the Eurostat national accounts dataset, which contains information on total employment and total hours worked. Hours worked per worker are obtained by dividing total hours worked by total employment. The second is the European Union Labour Force Survey (EU-LFS). The EU-LFS collects data on “number of hours usually worked per week” and “number of hours actually worked during the reference week”. The number of hours usually worked per week comprises all hours including extra hours (either paid or unpaid) that a person normally works. The number of hours actually worked during the reference week covers all hours including extra hours regardless of whether they were paid or not.
- Data collected in Maddison, A., The World Economy: A Millennial Perspective, OECD, 2001. More specifically, annual hours worked per worker in 1870 were 2,945 in France, 2,841 in Germany, 2,886 in Italy and 2,964 in the Netherlands. By 1973, hours worked per worker had declined to 1,771 in France, 1,804 in Germany, 1,612 in Italy and 1,751 in the Netherlands.
- Boppart, T. and Krusell, P., “Labor Supply in the Past, Present, and Future: A Balanced-Growth Perspective”, Journal of Political Economy, Vol. 128, No 1, 2020. The authors argue that the key to falling hours is that the income effect allowed by productivity slightly overweights the substitution effect.
- For explanations on hours worked per worker based on taxation, see, for example, Prescott, E.C., “Why Do Americans Work So Much More Than Europeans?”, Quarterly Review, Federal Reserve Bank of Minneapolis, Vol. 28, No 1, 2004; Ohanian, L., Raffo, A. and Rogerson, R., “Long-term changes in labor supply and taxes: Evidence from OECD countries, 1956-2004”, Journal of Monetary Economics, Vol. 55, Issue 8, 2008, pp. 1353-1362; and Bick, A., Brüggemann, B., Fuchs-Schündeln, N. and Paule-Paludkiewicz, H., “Long-term changes in married couples’ labor supply and taxes: Evidence from the US and Europe since the 1980s”, Journal of International Economics, Vol. 118, Issue C, 2019, pp. 44-62. See also Eckstein, Z. and Wolpin, K.I., “Dynamic Labour Force Participation of Married Women and Endogenous Work Experience”, Review of Economic Studies, Vol. 56, No 3, 1989, pp. 375-390.
- This includes more flexibility in terms of the duration of the work week and annual leave plans. Other regulations, such as the Framework Agreement on part-time work (Directive 97/81/EC), facilitated the use of part-time work.
- Marketisation of home production refers to the shift of traditional household production to the market. This includes food preparation, childcare, elderly care and house cleaning. See, for example, Freeman, R.B. and Schettkat, R., “Marketization of Household Production and the EU-US Gap in Work”, Economic Policy, Vol. 20, No 41, 2005, pp. 5-50; Fang, L. and McDaniel, C., “Home hours in the United States and Europe”, The B.E. Journal of Macroeconomics, Vol. 17, Issue 1, 2017, pp. 1-27; and Bridgman, B., Duernecker, G. and Herrendorf, B., “Structural transformation, marketization, and household production around the world”, Journal of Development Economics,
Vol. 133, Issue C, 2019, pp. 102-126. - See the article entitled “The impact of the COVID-19 pandemic on the euro area labour market”, Economic Bulletin, Issue 8, ECB, 2020.
- Other changes include labour market polarisation. See, for example, Dias da Silva, A., Laws, A. and Petroulakis, F., “Hours of work polarisation?”, Working Paper Series, No 2324, ECB, 2019.
- Between 1995 and 2019, annual hours worked per capita in the euro area increased from 696 to 738.
- The structural transformation in the industry structure of the economy, from agriculture and manufacturing to services, is documented in Herrendorf, B., Rogerson, R. and Valentinyi, A., “Growth and Structural Transformation”, Handbook of Economic Growth, Vol. 2, 2014, pp. 855-941. See also Crozet, M. and Milet, E., “The Servitization of French Manufacturing FirmsThe Factory-Free Economy: Outsourcing, Servitization, and the Future of Industry”, in Fontagné, L. and A. Harrison (eds.), “”, Chapter 4, 2017, for further details on the “servitisation” of French manufacturing firms.
- Despite the long-term trends in the employment-to-population ratio and hours worked per worker in the euro area and the lack of those trends in the United States, the cyclical adjustment of average hours worked is more marked for the euro area countries than for the United States. See Dossche, M., Lewis, V. and Poilly, C., “Employment, hours and the welfare effects of intra-firm bargaining”, Journal of Monetary Economics, Vol. 104, 2019, pp. 67-84, for more details on this comparison. The cyclical adjustment of average hours worked in the euro area is considered further in Section 3 of this article.
- The difference between the employment-to-population ratio and the labour force participation rate relates to the number of unemployed workers. While unemployment fluctuates with business cycles, usually decreasing during upturns and increasing during downturns, there has been no major structural change in the unemployment rate in the euro area in the last three decades, as documented in “How does the current employment expansion in the euro area compare with historical patterns?”, Economic Bulletin, Issue 6, ECB, 2019. As such, structural changes in labour force participation are the main drivers of long-term movements in the employment-to-population ratio in the euro area.
- The increase in labour force participation for women in the euro area can be linked to several factors, such as: (1) behavioural differences between generations regarding labour supply decisions at the household level, as set out in Vlasblom, J. and Schippers, J., “Increases in Female Labour Force Participation in Europe: Similarities and Differences”, European Journal of Population, Vol. 20, 2004, pp. 375-392; (2) the marketisation of home production, as described by Buera, F. and Kaboski, J., “The Rise of the Service Economy”, American Economic Review, Vol. 102, No 6, 2012, pp. 2540-2569; Ngai, R. and Petrongolo, B., “Gender Gaps and the Rise of the Service Economy”, American Economic Journal: Macroeconomics, Vol. 9, No 4, 2017, pp. 1-44; Bridgman, B., Duernecker, G. and Herrendorf, B., “Structural transformation, marketization, and household production around the world”, Journal of Development Economics, Vol. 133, 2018, pp. 102-126; and Reimers, P., “Industry Structure and the Composition of Men’s and Women’s Productive Time”, mimeo, 2020; (3) changes in labour market institutions, as argued by Cipollone, A., Patacchini, E. and Vallanti, G., “Female labour market participation in Europe: novel evidence on trends and shaping factors”, IZA Journal of European Labor Studies, Vol. 3, 2014; and Kelly, S., Watt, A., Lawson, J. and Hardie, N., “Disentangling the drivers of labour force participation by sex – a cross country study”, CEPR Discussion Paper 15661, Centre for Economic Policy Research, 2021; or (4) changes in tax wedges on second earners and single parents, as discussed in Bick, A. and Fuchs-Schündeln, N., “Taxation and Labour Supply of Married Couples across Countries: A Macroeconomic Analysis”, The Review of Economic Studies, Vol. 85, Issue 3, 2018, pp. 1543-1576; and Bick, A., Brüggemann, B., Fuchs-Schündeln, N. and Paule-Paludkiewicz, H., “Long-term changes in married couples’ labor supply and taxes: Evidence from the US and Europe since the 1980s”, Journal of International Economics, Vol. 118, Issue C, 2019, pp. 44-62.
- In the EU-LFS, the distinction between full-time and part-time work is generally based on a spontaneous response by the respondent. The main exception among euro area countries is the Netherlands, where a 35-hour threshold is applied.
- The reasons for taking up part-time work differ between men and women. According to data from the EU-LFS, the two most important reasons for men to work part-time are “Person could not find a full-time job” and “Person is undergoing school education or training”. For women, the single most important reason is “Looking after children or incapacitated adults”, followed by “Person could not find a full-time job” and “Other family or personal reasons”.
- Changes in regulations were an important element in the increase in part-time work. Other regulation affecting working time appears to have been less important, as there is no significant long-term difference between usual and actual hours worked, which could indicate an increase in annual leave days.
- The patterns shown in Chart 6 (panel a) are also similar when splitting the sample by gender, with the average hours worked by a full-time worker and a part-time worker remaining broadly constant over time, and with the share of part-time employment increasing over time. Moreover, new hires are more likely to work part-time than workers who remain with their employers for more than one year. In 2019 about 28% of new hires worked part-time, while around 20% of tenured workers worked part-time.
- See also “Labour supply and employment growth”, Economic Bulletin, Issue 1, ECB, 2018.
- Between 2000 and 2019, the share of part-time employment increased by 10.5 percentage points in Italy, 9.6 percentage points in the Netherlands, 8.8 percentage points in Germany, 6.7 percentage points in Spain and 1.4 percentage points in France.
- During recessions, workers may be offered fewer hours than they would wish to work, as reflected by an increase in involuntary part-time work. Further details are provided in Section 3.
- The results in Table 1 do not necessarily imply a causal relation on the drivers of average hours worked. Instead, they provide a characterisation of the long-run association between average hours worked, part-time employment and the business cycle in the euro area.
- For an earlier assessment of the decline in underemployed part-time workers during the latest economic expansion, see “Recent developments in part-time employment”, Economic Bulletin, Issue 2, ECB, 2018.
- Both younger and older workers work fewer hours on average than prime-age workers. In the period considered, composition effects arising from changes in the age structure of the workforce had a very small impact on the decline in average hours worked due to offsetting effects. The increasing share of older workers has been offset by a declining share of younger workers, which is the group that works more part-time and fewer hours. Instead, hours worked per worker declined across all age groups. For the younger cohorts, the main reason for a higher incidence of part-time work is that the “person is undergoing school, education or training”. While age composition effects have not played an important role until now, it is expected that ageing will exert downward pressure on average hours worked in the future.
- Self-employment accounts for about 25-35% of the decline in hours worked in the euro area, depending on whether the national accounts or the EU-LFS are used. The share of women in self-employment increased from 28% in 2000 to 33% in 2019, as the number of self-employed women increased by 30.5% in this period. While self-employed with employees declined by 17% for men and stabilised for women, own-account self-employment increased by 15% for men and 46% for women. Own-account self-employed people work significantly fewer hours (40.1 hours a week in 2019) than self-employed people with employees (48.8 hours a week in 2019).
- See the article entitled “Potential output in the post-crisis period”, Economic Bulletin, Issue 7, ECB, 2018.
- From 2001 to 2013, the negative contribution to potential growth of trend hours worked per worker represents almost 68% of the positive contribution of the trend labour force. This ratio rises to 180% over the period 2014-19, as the increase in trend labour force participation slows down while that of hours worked per worker continues to decrease at a similar rate to that observed previously.
- See the article entitled “Drivers of rising labour force participation – the role of pension reforms”, Economic Bulletin, Issue 5, ECB, 2020.
- See, for example, Collewet, M. and Sauermann, J., “Working hours and productivity”, Labour Economics, Vol. 47, August 2017, pp. 96-106.
- See the article entitled “The impact of COVID-19 on potential output in the euro area”, Economic Bulletin, Issue 7, ECB, 2020.
- The U7 rate is the sum of the unemployed and workers in job retention schemes, divided by the labour force. For an application of this metric, see, for example, “A preliminary assessment of the impact of the COVID-19 pandemic on the euro area labour market”, Economic Bulletin, Issue 5, ECB, 2020.
- The trade and transport sector includes the wholesale and retail trade, accommodation and food services, and transport, while the recreation sector comprises recreational activities and personal services. See also “The impact of the COVID-19 crisis on the euro area labour market for men and women”, Economic Bulletin, Issue 4, ECB, 2021, for an earlier take on the sectoral impact of the pandemic on employment and average hours worked, and “The impact of the COVID-19 pandemic on the euro area labour market”, Economic Bulletin, Issue 8, ECB, 2020, for a sectoral analysis of potentially teleworkable jobs in the euro area.
- Sectoral data on the number of workers in job retention schemes for Germany, France and Spain show that usage of such schemes was widespread in the trade and transport sector. In May 2021, around 2.8 million workers in job retention schemes were working in the trade and transport sector, representing 54% of all workers in job retention schemes in these three countries. By country, the number of workers in job retention schemes in these sectors was about 1 million in Germany (43% of all workers in job retention schemes in the country), 1.5 million workers in France (63%) and 300,000 in Spain (66%).
- See Eser, F., Karadi, P., Lane, P.R., Moretti, L. and Osbat, C., “The Phillips Curve at the ECB”, The Manchester School, 2020.
- See Heathcote, J., Perri, F. and Violante, G.L., “The rise of US earnings inequality: Does the cycle drive the trend?”, Review of Economic Dynamics, Vol. 37, Supplement 1, 2020, pp. S181-204.


