Past and future challenges for the external competitiveness of the euro area
Published as part of the ECB Economic Bulletin, Issue 6/2024.
1 Introduction
Euro area exporters have been going through a difficult period since the pandemic and have lost competitiveness in global trade. Over the past two decades, the euro area has experienced a gradual decline in its market share in global trade. This downward trend is not unique to the euro area: other advanced economies have also been losing market shares as emerging economies become more integrated in global trade. While decreasing market shares do not necessarily reflect a decrease in competitiveness, the decline in the euro area’s role in trade has accelerated more sharply than in other regions since the pandemic, suggesting that the euro area is facing particular challenges to its external competitiveness.
This article analyses the long-term trends contributing to the decline in the euro area’s market share in the last two decades and relates more recent declines to a series of global shocks that had an asymmetric effect on the region, exposing important vulnerabilities in its external competitiveness. The article describes the longer-term trends in relative euro area export performance before discussing the drivers of the euro area’s weak export performance since the pandemic. These drivers include the energy shock following Russia’s invasion of Ukraine, supply disruptions, other factors affecting price and non-price competitiveness, and the role of trade in services since the pandemic. The article concludes by outlining some of the challenges that lie ahead, which relate to the persistence of the energy shock, risks associated with geo-economic fragmentation and the ongoing structural transformation of the European and global economies.
2 Longer-term trends in relative euro area export performance
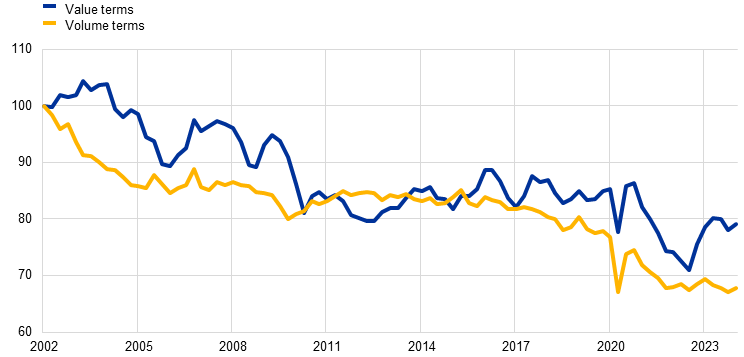
Over the past two decades the euro area has gradually lost market share in global exports of manufacturing goods. The euro area’s share in the volume of global goods exports, as well as that of other advanced economies, has followed a declining trend (Chart 1). This has largely been due to the growing integration of major emerging economies such as China in the global economy. Yet the decline in market share has been less pronounced in value terms, and market shares actually stabilised after 2012, reflecting higher export prices for euro area goods sold in pricier market segments. However, the last four years have seen renewed falls in the market share of the euro area.[1]
Chart 1
Euro area export market shares in goods
(index: Q1 2002 = 100)
Sources: CPB Netherlands Bureau for Economic Policy Analysis, ECB, IMF World Economic Outlook and ECB staff calculations.
Notes: Export market shares are calculated in value and volume terms. Export market shares in value terms are calculated by dividing the value of extra-euro exports by the value of world imports excluding the euro area. Similarly, export market shares in volume terms are calculated by dividing the volume of extra-euro exports by the volume of world imports excluding the euro area.
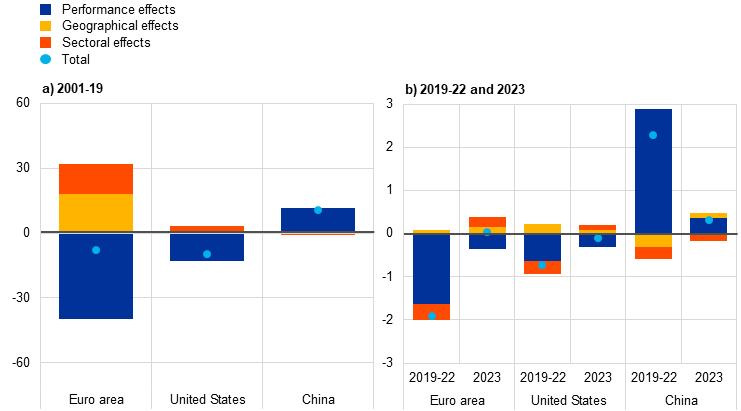
The evolution of the market share of the euro area reflects the euro area’s positioning and specialisation in key markets in terms of geography, as well as other factors affecting its competitiveness. The global export market share of an economy typically increases if that economy has established strong links with fast-growing trading partners that are outperforming the global economy or if it has acquired market power in product segments for which global import demand is expanding faster than average global imports. In this respect, a shift-share analysis provides a framework for decomposing changes in total market share into changes owing to (i) the growth of destination countries (geographical effect), (ii) the growth of specific product markets (sectoral effect), and (iii) other factors capturing changes in exporters’ price and non-price competitiveness (performance effect).[2]
Before the pandemic, exporters in the euro area benefited from the growth of its key trading partners and product segments. In the two decades up to the pandemic, geographical and sectoral effects supported the euro area’s market share. In fact, had the geographical and sectoral composition of euro area exports been less favourable, the losses in market share would have been almost twice as large as those observed between 2001 and 2019 (Chart 2). This pattern is not unique to the euro area – it can also be seen for other advanced economies such as the United States, albeit to a lesser extent. Performance-related losses in competitiveness in the United States may have been mitigated by more favourable developments in energy and labour costs and productivity compared with the euro area.[3] Emerging economies, notably China, recorded limited negative sectoral or geographical effects. As documented in the literature, this largely reflects differences in the technology intensity of exports between advanced and emerging economies. Higher technology intensity tends to support compositional effects in advanced economies, while price and cost factors strengthen the performance of emerging economies.[4]
Chart 2
Euro area goods export market shares and contributions
(percentage points)
Sources: Trade Data Monitor and ECB staff calculations.
Notes: Figures are expressed in terms of percentage changes in market shares with respect to 2001 in panel a) and with respect to 2019 and 2022 in the two columns in panel b), respectively. Market shares consider only the intensive margin and exclude energy and other specific and non-classified products (two-digit Harmonised System codes 25, 26, 27, 97, 98, 99).
During the pandemic, the composition of euro area exports temporarily caused the decline in market share to accelerate. Between 2019 and 2022 the beneficial compositional effect of euro area exports reversed, mainly reflecting low growth in the euro area’s main product segments. The low growth was partly due to lower demand for capital goods and industrial inputs as lockdown measures and supply disruptions fed through the value chain and curtailed production in the euro area’s trading partners. At the same time, households shifted their spending away from services towards at-home consumption, increasing global demand for consumer goods and electronic equipment primarily produced outside the euro area. Moreover, the literature finds that containment measures had a greater effect on production in industries that are located more downstream (such as the automotive, pharmaceutical, food and beverage and consumer electronics industries). These industries are more prevalent in the euro area than in its main trading partners.[5]
Although key markets in the euro area recovered to some extent in 2023, export performance was still rather anaemic. After the post-pandemic recovery, euro area exporters again benefited from some more favourable sectoral and geographical factors, but export growth remained weak. The following section provides an overview of the shocks that have contributed to the recent weakness in euro area exports.
3 Drivers of the recent weakness in euro area exports
This section looks at the main factors behind the euro area’s weak export performance since the pandemic. The previous section summarised broad trends in the deterioration of the euro area’s market share and isolated the impact of sectoral and geographical compositional effects over the past two decades. This section identifies the main drivers of export performance after the pandemic and during the subsequent period of surging energy prices. Specifically, it disentangles common elements, such as changes in price and non-price competitiveness, as well as new challenges posed by supply chain disruptions and the energy crisis.
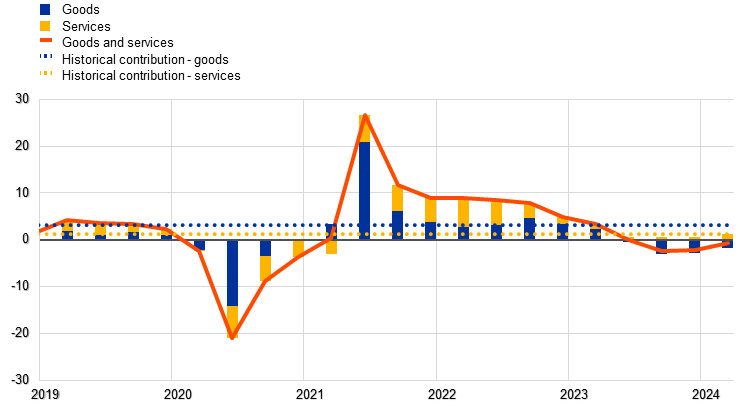
Mobility restrictions during the pandemic and the related persistent supply disruptions depressed euro area exports of goods and, to a greater extent, services; since then, services exports have strongly recovered but goods exports remain weak. Pandemic-induced demand shifts and supply chain disruptions were one of the main drivers of the deterioration in euro area export performance. Lockdowns, mobility restrictions and the ensuing transport and supply disruptions impeded the flow of goods globally. This had a particularly strong effect on the euro area as it is more deeply integrated in regional and global supply chains than other economies.[6] Global goods trade rebounded swiftly after the pandemic in 2021. However, it fell below historical trends towards the end of 2022, which was also reflected in weak euro area goods export growth (Chart 3). In addition, from 2022 euro area goods exports were held back by the energy price shock, recording negative growth from the second quarter of 2023. By contrast, services exports – which were a significant drag on euro area exports during the pandemic, especially in high-contact categories such as travel – became a driver of the recovery as mobility restrictions were gradually lifted and economies reopened. Box 1 discusses the resilience of the services export sector in recent years and the factors contributing to its unusual divergence from the goods sector.
Chart 3
Euro area exports of goods and services
(volumes, year-on-year percentage changes)
Sources: Eurostat and ECB staff calculations.
Note: Historical contribution refers to the average contribution over the period from the first quarter of 1995 to the first quarter of 2024.
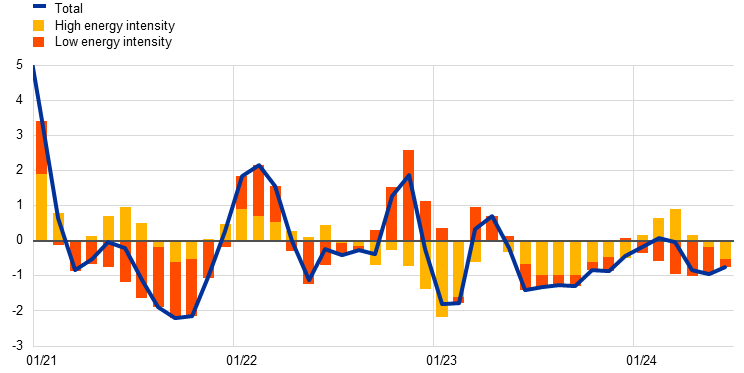
The key driver of the continued weakness in euro area goods exports was the energy shock following Russia’s invasion of Ukraine, as exports in energy-intensive sectors declined substantially. Energy prices began to rise from late 2021 as Europe experienced a particularly cold winter and Russia gradually reduced gas supplies to Europe. Gas prices then spiralled following Russia’s full-scale invasion of Ukraine in February 2022. Production costs rose to such an extent that some energy-intensive industries were forced to cut back or pause production. As a result, the exports of energy-intensive sectors decreased strongly, accounting for almost the entire decline in total exports in 2023 (Chart 4).[7]
Chart 4
Contributions of sectors to euro area goods export growth by energy intensity
(three-month-on-three-month percentage changes; percentage point contributions)
Sources: Eurostat and ECB staff calculations.
Notes: Seasonally adjusted volume indices of manufactured goods exports. Low (high) energy-intensity sectors have energy intensity below (above) the median. Energy intensity is the share of energy (direct and indirect use) in total inputs. The latest observations are for June 2024.
The recent gas price shock hit the euro area more than other regions and substantially worsened its competitiveness relative to its main trading partners. The gas price shock following Russia’s invasion of Ukraine was different from past energy crises – which were caused by oil price shocks – because of its regional nature, with cuts in gas supplies from Russia primarily affecting Europe.[8] In the third quarter of 2022, at the peak of the European gas crisis, the EU benchmark gas price index was 20 times its historical average, ten times the US benchmark and well above Asian benchmarks, highlighting the exceptional nature of the European gas shock. The asymmetric nature of the energy shock hit euro area export market shares as input costs of euro area exporters rose relative to those of their competitors in the euro area’s main trading partners (see Box 2).
Losses of price and cost competitiveness owing to the asymmetric energy shock were to some extent – but far from completely – buffered by exchange rate movements. The impact of rising costs in the euro area was cushioned by the depreciation of the exchange rate of the euro during the early phase of the energy crisis. The euro weakened significantly in nominal effective terms in 2021 and early 2022, which helped to buffer the euro area’s competitive position.[9] In real effective terms, this was further supported by relatively contained increases in unit labour costs compared with competitors.[10] However, unit labour costs primarily capture domestic cost pressures, whereas external cost pressures from higher-input import prices are better reflected in the producer price index (PPI). PPI-based real effective exchange rates, which summarise relative price pressures for tradable goods, point to a deterioration in export price competitiveness and suggest that the energy shock had a bigger impact on euro area competitiveness (Chart 5). Moreover, the previous gains in competitiveness from the nominal depreciation of the euro started to unwind from mid-2022 owing to a strengthening euro and rising price and cost pressures relative to competitors.[11]
Chart 5
Euro area effective exchange rate
(index: Q1 2019 = 100)

Source: ECB.
Note: CPI refers to consumer price index.
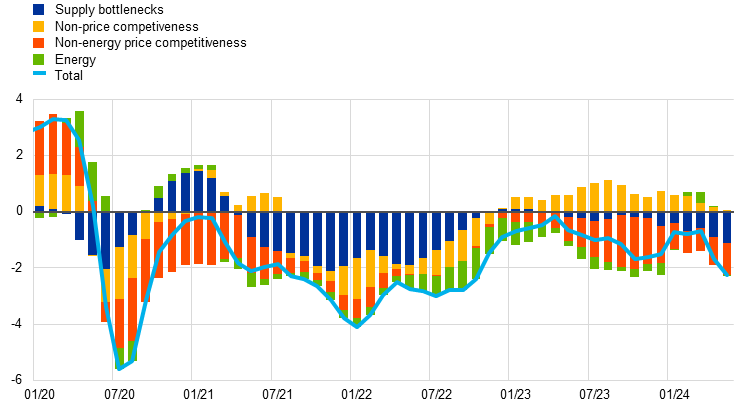
A model-based analysis confirms that, while pandemic-related supply bottlenecks were the main initial driver of weak export performance, energy costs and other price competitiveness factors have since become the main drag on euro area competitiveness. Results from a Bayesian structural vector autoregression (SVAR) analysis with sign restrictions illustrate the relative importance of four specific shocks: supply disruptions, energy price shocks, other price competitiveness shocks and non-price competitiveness shocks. Non-energy price competitiveness shocks encompass all factors that affect export shares through relative prices, such as input prices, labour costs and exchange rate conditions. Shocks to non-price competitiveness include all other conditions that affect demand for euro area products, sectoral demand growth, productivity gains and other idiosyncratic factors enhancing market presence (Chart 6). Supply chain disruptions and losses in non-price competitiveness explain about two-thirds of the deterioration in export market shares following the outbreak of the pandemic, given the euro area’s high degree of integration in regional and global supply chains.[12] The negative contribution of non-price competitiveness reflects a shift in global consumer demand away from goods traded by the euro area – such as investment-related goods – towards other items such as computer equipment and home improvement products, which are more extensively exported by competitors. They could also partly reflect the breakdown of trade relations with Russia. Following the invasion of Ukraine and the imposition of sanctions on Russia, euro area exports to Russia halved within months and have continued to decline since then. Since mid-2022, as supply disruptions faded and global demand patterns began to normalise, these factors no longer weighed on, or even buffered, euro area market shares.[13] At the same time, energy costs and other price competitiveness factors became a major drag on the euro area’s export performance relative to its competitors.
Chart 6
Structural drivers of euro area goods exports market shares
(percentage deviations from trend; percentage point contributions)
Source: Eurostat and ECB staff calculations.
Notes: The SVAR is estimated at a monthly frequency over the period from January 2004 to May 2024 and includes the following variables: extra-euro area export market shares (de-trended), euro area nominal effective exchange rate (increase = appreciation), euro area relative export prices, and the ratio of energy-intensive to non-energy-intensive industrial production. The assumed sign restrictions on impact are: a non-price competitiveness shock implies extra-euro area export market shares (+), euro area relative export prices (+); a price competitiveness shock implies extra-euro area export market shares (+), euro area nominal effective exchange rate (-), euro area relative export prices (-); a supply bottleneck shock implies extra-euro area export market shares (-), euro area nominal effective exchange rate (-), euro area relative export prices (+), energy-intensive to non-energy-intensive industrial production (+); an energy shock implies extra-euro area export market shares (-), euro area nominal effective exchange rate (-), euro area relative export prices (+), energy-intensive to non-energy-intensive industrial production (-).[14]
Box 1
Will trade in services continue to act as a buffer for euro area export growth?
In recent years, exports of services have majorly supported euro area trade, significantly outperforming exports of goods. This box examines whether this unusual decoupling of growth in services exports and goods exports can be expected to continue.
Services exports have grown at a faster pace than goods exports over the past 20 years as technological progress has made it possible for many services to be delivered and consumed in locations different from their origin, making them more tradable across borders. The share of services in the total value of euro area exports increased from 24% in 2000 to around 31% in 2023.
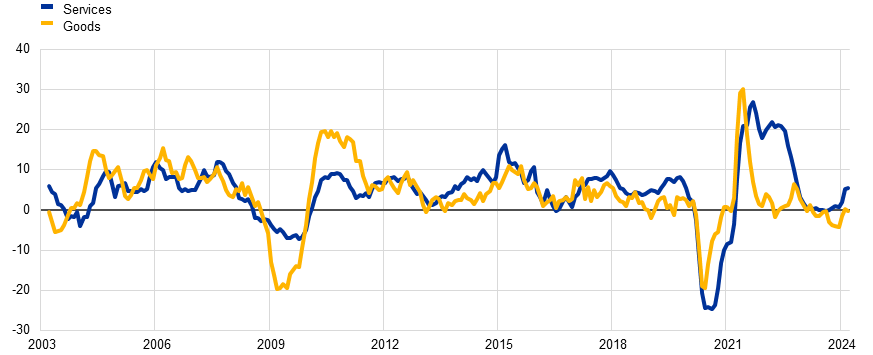
However, the recent stronger performance of services exports has been particularly notable. Services rebounded substantially after the pandemic and have continued to grow even as goods exports have contracted (Chart A). In 2022 services exports accounted for two-thirds of the annual growth in total euro area export volumes. This divergence has continued since September 2023, with goods exports falling and services exports continuing to expand.
Chart A
Euro area goods and services export growth
(three-month moving average of year-on-year percentage changes, constant prices)
Sources: Eurostat and ECB calculations.
Notes: Extra-euro area exports from the balance of payments are deflated using prices of intra-euro area plus extra-euro area exports from the main national accounts. The latest observations are for March 2024.
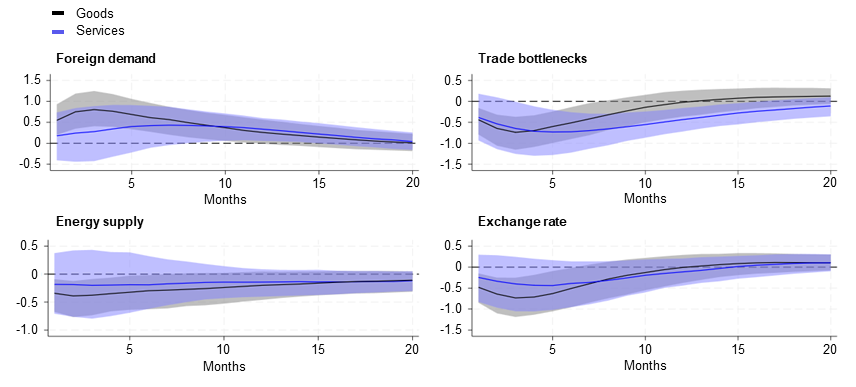
Services and goods exports have co-moved closely in the past. Over the past 15 years the correlation between the year-on-year growth rates of services and goods export volumes is roughly 0.6. Empirical evidence from an SVAR model suggests that goods and services exports react similarly to a variety of shocks (Chart B).[15] Indeed, the main macroeconomic drivers of services and goods exports are similar, with the bulk of the cyclical fluctuation (74% of goods and 66% of services exports) explained by foreign demand, supply bottlenecks, energy supply and the exchange rate.
Chart B
Impulse responses of goods and services exports volumes
(response to a one-standard-deviation shock; percentage point deviation from steady state)
Source: Eurostat, CPB Netherlands Bureau for Economic Policy Analysis, Federal Reserve of New York and ECB calculations.
Notes: Shaded blue and grey areas are confidence intervals for services and goods exports (both 68%). For details on the estimation, see footnote 15.
The historical similarity in the cyclical dynamics of goods and services exports reflect the close links between the two sectors. First, a large share of services exports are used as intermediates for goods production – just under half of the euro area’s value added in services exports are used as intermediate inputs for goods production in other countries.[16] Second, many services exports are directly related to goods exports. Sectors such as transport, trade-related services and freight insurance account for more than 20% of euro area services exports.[17] Finally, an important share of services are exported by manufacturers that bundle goods and services products together.[18]
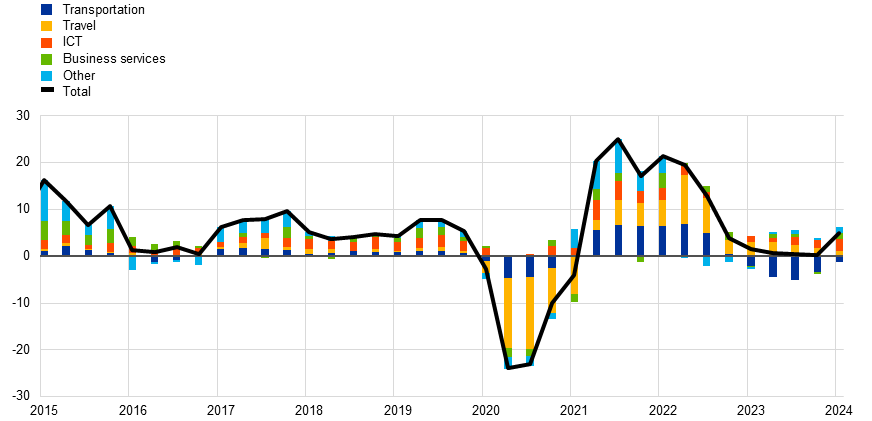
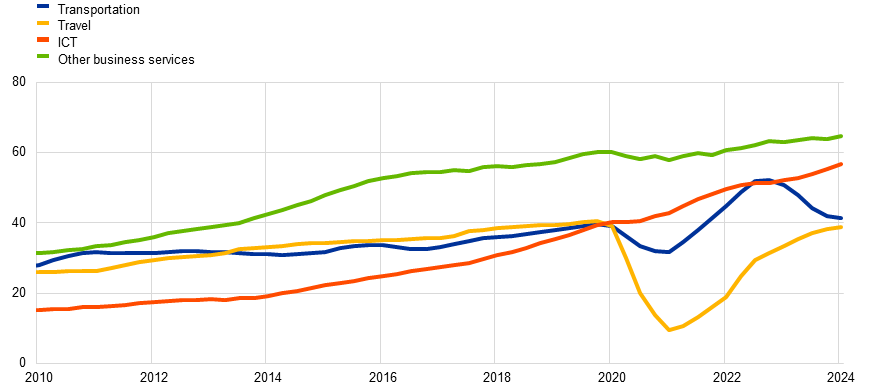
The recent episode of pronounced decoupling was unusual and stemmed from the pandemic and large swings in travel services. The sectoral decomposition highlights the after-effects of the pandemic, including a strong rebound in exports of travel services (Chart C). In 2021 travel contributed around 30% to the growth in services exports, although it accounted for only 12% of total services export volumes. Services exports have held up thanks to the positive contribution of travel exports in 2023.[19] By contrast, transport exports, which had recovered from the pandemic by 2021, have been declining since 2022 owing to a period of restocking coming to an end and the impact of the energy shock on manufacturing firms.
Chart C
Sectoral decomposition of growth in euro area services export volumes
(year-on-year percentage changes; percentage point contributions)
Sources: Eurostat and ECB calculations.
Notes: Volumes are calculated by applying the overall services exports deflator. ICT refers to information and communications technology. The latest observations are for the first quarter of 2024.
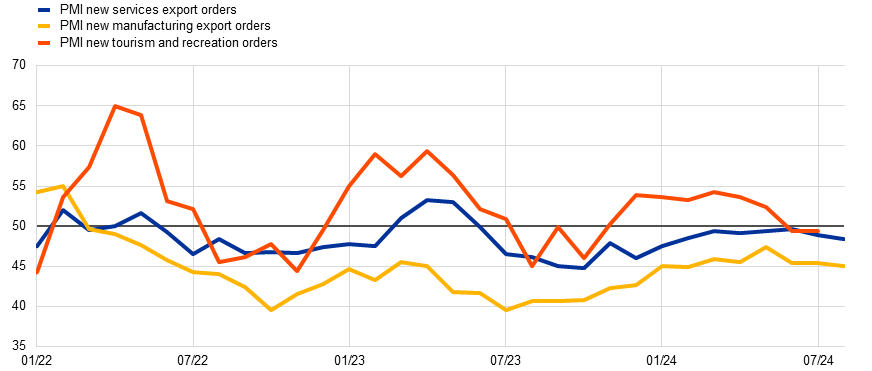
Over longer periods, services exports are likely to grow at a faster pace than goods exports, consistent with their stronger long-run trend. However, in the near-term that stronger performance may be boosted by the ongoing strength of travel services exports, which are yet to recover to their pre-pandemic level (Chart D, panel a). Tourism sector surveys remain more buoyant than those of broader services (and goods) export sectors, which suggests near-term strength (Chart D, panel b).
Chart D
Euro area services exports volumes by sub-sector and PMI orders
a) Euro area services exports volumes by sub-sector
(EUR billions; four-quarter moving average)
b) PMI manufacturing, services and tourism orders
(diffusion index)
Sources: Eurostat, S&P Global and ECB calculations.
Notes: Volumes in panel a) are calculated by applying the overall services exports deflator. PMIs shown in panel b) are for the EU. A number above 50 indicates an expansion and a number below 50 indicates a contraction. The latest observations are the first quarter of 2024 for panel a), and August 2024 for manufacturing and services export orders and July 2024 for tourism orders in panel b).
Box 2
Energy cost differentials and euro area competitiveness
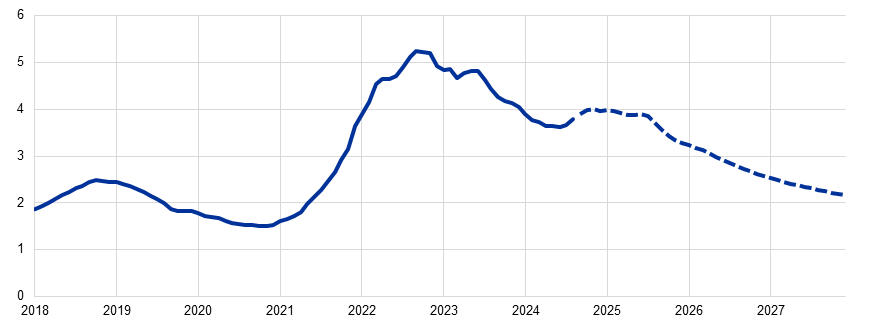
During the energy crisis the price differential for gas and electricity in Europe relative to other regions reached unprecedented highs.[20] Euro area producer prices for energy were twice as high as those of its main competitors.[21] The differential relative to the United States was even wider (Chart A). This box assesses the impact of the energy shock on the competitiveness of euro area exporters and illustrates the shock’s heterogeneous effects on firms.[22]
Chart A
Energy prices in the euro area relative to the United States
(ratio)
Sources: ADB MRIO, IMF, Bloomberg, Trade Data Monitor and ECB staff calculations.
Notes: The relative energy price is computed as a weighted average of the relative natural gas price and the relative oil price The solid line represents historical data up to August 2024. The dashed line shows the estimated evolution of the relative energy price based on future prices for crude oil and natural gas in Europe and in the United States. The last estimate is for December 2027.
Exposure to the energy shock varied substantially across industries depending on the energy intensity of production processes and the share of natural gas in total energy consumption. However, the impact of an energy shock on an industry’s export prices and market share does not only depend on an industry’s input costs. It also depends on its position in the production chain. At industry level, the position of production processes in the chain can be determined by two coordinates, the distance from final demand (“upstreamness”) and the distance from primary inputs (“downstreamness”). Positioning can influence the transmission of energy shocks in several ways. Upstream industries generally operate on tighter margins and thus tend to pass on the entire shock. In addition, since energy is often a key input for upstream industries, it may not be as easy for them to substitute domestic inputs with outsourced inputs as it is for downstream industries. At the same time, the more downstream a firm is in a production chain, the more likely it is for part of the energy shock to have been absorbed by the profit margins of producers positioned earlier in the chain. Thus, while upstreamness could magnify the effect of energy shocks, downstreamness may temper the effect as shocks move down the production chain.[23]
We test these arguments in a panel setting, which enables us to measure how the impact of the energy shock varies across industries and economies and to differentiate industries according to their position in the production chain. It also makes it possible to control for those factors which are difficult to observe or measure but are correlated with energy cost differentials, such as government measures.[24] This box shows the results of a panel study of euro area export market shares. The study uses quarterly data spanning from the beginning of 2007 to the end of 2022 for 17 manufacturing industries in 20 euro area countries. It proxies the energy shock for the euro area by including a variable that measures the energy cost differential relative to a key competitor, the United States. The equation is specified as a logarithmic dynamic panel with fixed effects:
(1)
are exports (export prices) of a sector () in a euro area country ) relative to exports (export prices) for the same sector () in non-euro area countries at a time ().[25] The energy shock ) in a sector () of a euro area country ) at a time () is defined by the energy cost differential scaled by the energy intensity of production. Heterogeneity in the exposure to the energy crisis is allowed to differ across industry-country pairs by relating the energy cost shock () to a measure of an industry’s position in the chain, that is the number of links with upstream) and downstream industries. Finally, the analysis controls for unobserved effects by including sector-country fixed effects () and country-time fixed effects. The estimated coefficients ( are historical elasticities of euro area external competitiveness to energy cost differentials depending on energy intensity and upstream and downstream positioning.
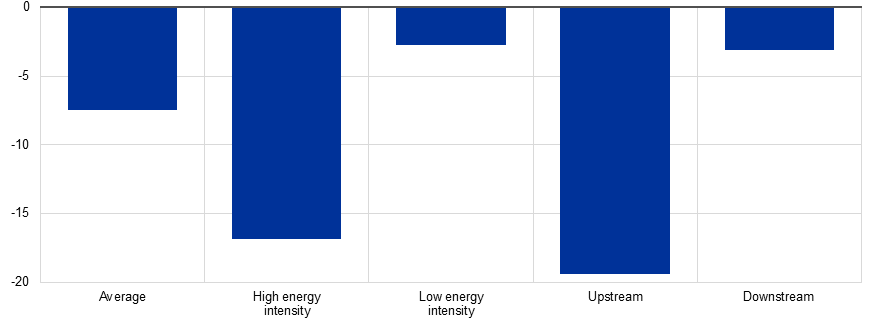
The panel estimates indicate that, at the peak of the European gas crisis, the average adverse impact on euro area export market shares was -7%. However, the estimates show marked heterogeneity. The impact on industries with the highest energy intensity was a decline of more than 15% in export market shares; this can grow to almost 20% for industries located very upstream in the chain and fall to around 3% for industries at the very end of the supply chain.
Chart B
The impact on export market shares of the energy cost differential at the peak of the gas crisis in the third quarter of 2022 by type of industry
(percentages)
Sources: Trade Data Monitor, IMF, MRIO, TiVA, Mancini, M. et al. (2024) and ECB staff calculations.
Notes: Changes in export market shares evaluated at the highest/lowest energy intensity. Most upstream/downstream industries are based on coefficients estimated in equation (1). The effect of one determinant is evaluated at a time, setting the others to zero. This simplification helps us to isolate the effect of each determinant. As positioning in the chain for each industry-country pair is mapped by two coordinates (upstream and downstream) the total effect of positioning in the supply chain is given by the weighted average of the effect implied by the two coordinates.
4 Challenges ahead
Looking ahead, some of the factors that have affected euro area export market shares in the recent past should fade away. The supply disruptions and shifts in global demand preferences that hindered euro area exports during the pandemic are gradually diminishing. Price competitiveness challenges in the medium term should also fade as comparatively higher costs in the euro area subside.[26] Nonetheless, euro area exporters could continue to face a challenging environment.
At the same time, competitiveness challenges could persist as energy costs will likely remain elevated, and the euro area is still vulnerable to changes in global market conditions owing to its continued dependence on energy imports. The energy shock was a major driver of the deterioration in euro area market shares. Meanwhile, elevated energy costs for the foreseeable future pose a significant challenge to the competitiveness of the euro area, especially as energy prices in the euro area are still substantially higher than those of its main competitors and – based on futures prices – are expected to remain twice as high as those in the United States in the coming years.
The recent crises have also exposed the euro area’s vulnerability to input supply and cost shocks more generally, which may be further compounded by geo-economic fragmentation. Recent evidence on the incidence of geo-economic fragmentation, notably with respect to trade and foreign direct investment flows, shows how economic linkages are increasingly influenced by geopolitical considerations.[27] For the euro area, there is evidence that firms progressively seek to diversify their supply of strategic goods to source these from producers in geopolitically aligned countries.[28] Such strategic diversification, while potentially increasing the resilience of supply chains, could lead to cost increases and have important implications for the competitiveness of euro area exporters. At the same time, fragmentation patterns may also affect the demand for euro area exports. Moreover, increasing geopolitical tensions may lead to new waves of tariffs and other trade restrictions that would weigh on global trade, with significant consequences for the euro area export sector.
Looking ahead, the structural transformation of the European and global economies could present challenges and opportunities for euro area exporters. The transformation of the EU’s energy market and supplies and the green transition will have important implications for the competitiveness of the euro area.[29] Likewise, the shift of global trade towards services and the potential opportunities emerging from advances in information technology and artificial intelligence are expected to significantly affect euro area exporters’ competitiveness in the future.[30] In particular, euro area exporters are increasingly confronted with growing competitive pressures from emerging economies, which are becoming suppliers of high value-added content and competing in some of the euro area’s key markets. Euro area exporters are currently facing competition from Chinese manufacturers that benefit from vast capacity, partly owing to sizeable subsidies. This capacity well exceeds domestic demand in China, leading to downward pressure on Chinese export prices and ultimately translating into significant losses of price competitiveness for the euro area.[31] Nevertheless, euro area exporters can maintain their market presence in value terms by specialising in higher-value segments such as services, for which the euro area is the world’s leading exporter. This would allow them to charge premium prices and improve the euro area terms of trade.
Long-run trends in export market shares in volume terms should be interpreted with caution. Euro area export volumes and world import volumes are not fully consistent, as each statistical office employs specific methodologies for deflating and outlier cleaning. These methodologies may differ in terms of outlier detection and replacement and quality adjustment.
See Cheptea, A., Fontagné, L., and Zignago, S., “European export performance”, Review of World Economics, Vol. 150, 2014, pp. 25-58. The geographical, sectoral, and performance effects are estimated using bilateral product-level non-energy goods export data from Trade Data Monitor:
The growth rate of each individual export flow (X) is estimated by a fixed-effects (FE) regression in which the geographical, sectoral and performance effects correspond to the fixed effects on importer j, product segment k and exporter i. In a second step, those are aggregated to the exporter level and translated into market share growth.See the box entitled “Key factors behind productivity trends in euro area countries”, Economic Bulletin, Issue 7, ECB, 2021.
See, for example, Beltramello, A., De Backer, K. and Moussiegt, L., “The export performance of countries within global value chains (GVCs)”, OECD Science, Technology and Industry Working Papers, No 2012/2, OECD Publishing, Paris, 2012.
See, for example, “Global Trade and Value Chains during the Pandemic”, World Economic Outlook: War Sets Back the Global Recovery, IMF, Washington DC, April 2022.
See the box entitled “Global value chains and the pandemic: the impact of supply bottlenecks”, Economic Bulletin, Issue 2, ECB, 2023.
For the effects of high energy costs on production, see the box entitled “How have higher energy prices affected industrial production and imports?”, Economic Bulletin, Issue 1, ECB, 2023.
See the box entitled “The energy shock, price competitiveness and euro area export performance”, Economic Bulletin, Issue 3, ECB, 2023.
See also “Relative energy price rise hurting, euro depreciation supporting Germany’s international price competitiveness”, Deutsche Bundesbank Monthly Report, December 2022.
For a comparison of labour costs in the euro area and the United States, see the box entitled “Inflation developments in the euro area and the United States”, Economic Bulletin, Issue 8, ECB, 2022.
With regard to competitiveness factors, at the end of 2023 unit labour cost growth remained strong in the euro area whereas it had already started to decelerate in other countries (e.g. the United States), albeit remaining at higher levels. Higher unit labour costs reflect relatively higher wages and lower productivity in the euro area. See the box entitled “Recent inflation developments and wage pressures in the euro area and the United States”, Economic Bulletin, Issue 3, ECB, 2024.
For more details, see the box entitled “The impact of supply bottlenecks on trade”, Economic Bulletin, Issue 6, ECB, 2021. See also Lebastard, L. and Serafini, R., “Understanding the impact of COVID-19 supply disruptions on exporters in global value chains”, Research Bulletin, No 105, ECB, March 2023.
Some of the negative contributions of supply bottlenecks from mid-2023 may be related to a deterioration in supplier delivery times as activity recovered and to disruptions in the Red Sea following attacks by Houthi rebels. See Attinasi M.G., Boeckelmann L., Emter L., Ferrari M.M., Gerinovics R., Gunnella V., Meunier B. and Serafini R., “Sailing through storms: The fallout of Red Sea disruptions for global trade and inflation”, VoxEU Column, April 2024.
A positive sign of supply bottlenecks for energy-intensive to non-energy intensive industrial production is motivated by the fact that highly energy-intensive sectors rely more on commodity inputs that are not disrupted by supply bottlenecks.
The model extends the SVAR with sign restrictions used to analyse goods exports – see the box entitled “The energy shock, price competitiveness and euro area export performance”, op. cit. The analysis imposes no restrictions on the response of services exports to identified shocks, which ensures that co-movement in the responses is not driven by assumptions. The following variables are included: synthetic energy price index, ratio of energy-intensive to non-energy-intensive industrial production, world imports, Harmonised Index of Consumer Prices, global supply chain pressure index, extra-euro area goods exports, euro area nominal effective exchange rate, extra-euro area services exports. Note that confidence intervals for services exports are somewhat wider than those for goods exports (Chart B), potentially owing to their more diverse composition, with services exports in different sub-sectors likely showing heterogenous responses to shocks.
Based on ECB staff calculations using multiregional input-output data from the Asian Development Bank.
The analysis applies the classification of the United Nations Statistics Division for goods-related services sub-sectors to euro area export data.
Ariu, A. et al. document that 23% of services exports from Belgium are bundled together with exports of goods. See Ariu, A., Mayneris, F. and Parenti, M., “One way to the top: How services boost the demand for goods”, Journal of International Economics, Vol. 123, March 2020.
The share of business in total travel exports has declined from 18% in 2019 to 12% in 2022. For more on the performance of the travel sector during the pandemic, see the box entitled “Developments in the tourism sector during the COVID-19 pandemic”, Economic Bulletin, Issue 8, ECB, 2020.
The cost differential remained contained for oil, whose quotations rose in tandem across regions.
The producer price index for energy in the euro area is compared with the weighted average of the PPI for energy of its main competitors (United States, United Kingdom, China and Japan), with weights assigned based on the share of each competitor in the competitors’ total sum of exports.
See also the box entitled “The energy shock, price competitiveness and euro area export performance”, op. cit.
For computation of upstreamness and downstreamness metrics, see Mancini, M., Montalbano, P., Nenci, S. and Vurchio, D., “Positioning in Global Value Chains: World Map and Indicators, a New Dataset Available for GVC Analyses”, The World Bank Economic Review, 2024.
Governments reacted to the energy shock by implementing measures to limit the impact on businesses and consumers. Failing to control for these measures could result in an underestimation of the potential impact of a widening in the energy cost differential vis-à-vis competitors for euro area external competitiveness. Similar attenuation biases could stem from exchange rate repricing dynamics and expenditure shifting away from expensive energy-intensive items.
Relative export prices in equation (1) are instrumented with their four lags and other exogeneous determinants to remove the simultaneity bias of P and XMS, under the assumption that past values of P (XMS) are predetermined to future XMS (P) developments.
See Lane, P. R. and Milesi-Ferretti, G.M., “External Wealth, the Trade Balance, and the Real Exchange Rate”, European Economic Review, Vol. 46, No 6, 2002, pp. 1049-1071, and Bobeica E., Christodoulopoulou, S. and Tkačevs, O., “The role of price and cost competitiveness for intra-and extra-euro area trade of euro area countries”, Working Paper Series, No 1941, ECB, Frankfurt am Main, July 2016.
See, for example, Aiyar, S. et al., “Geoeconomic Fragmentation and the Future of Multilateralism”, Staff Discussion Notes, No 2023/001, International Monetary Fund, Washington DC, January 2023.
See the box entitled “How geopolitics is changing trade”, Economic Bulletin, Issue 2, ECB, 2024
See, for example the box entitled “Will the euro area car sector recover?”, Economic Bulletin, Issue 4, ECB, 2024, which includes a discussion of competitive challenges emerging from the greening of the car sector.
On the increasing relevance of services and automation, see Baldwin, R., “Globotics and macroeconomics: Globalisation and automation of the service sector”, Working Paper Series, No. 30317, National Bureau of Economic Research, August 2022.
See Emter, L., Gunnella, V., Ordoñez Martínez, I., Schuler, T., Al-Haschimi, A. and Spital, T., “Export markets: why China and the euro area are competing more than ever”, The ECB Blog, ECB, September 2024 and the article entitled “The evolution of China’s growth model: challenges and long-term prospects”, Economic Bulletin, Issue 5, ECB, 2024.


