The recent slowdown in euro area output growth reflects both cyclical and temporary factors
Published as part of the ECB Economic Bulletin, Issue 4/2018.
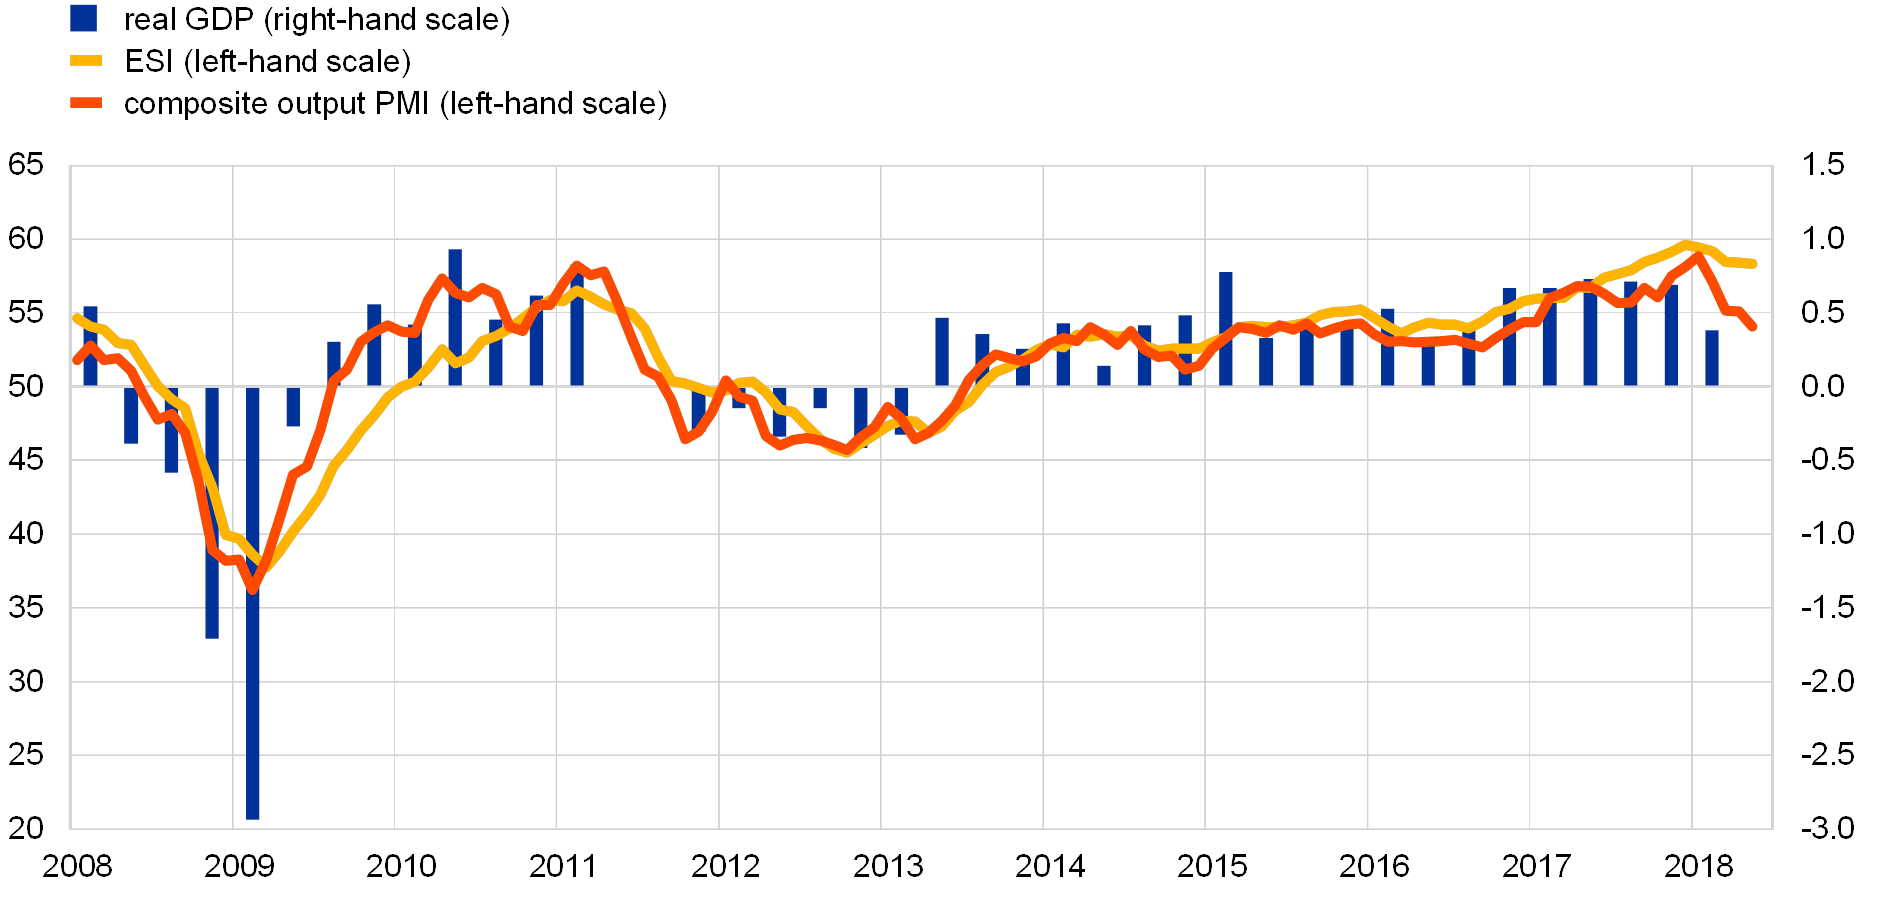
Following very strong growth rates in 2017, quarterly real GDP growth in the euro area moderated to 0.4% in the first quarter of 2018. The slowdown in growth at the start of the year, which appears to reflect temporary factors as well as more lasting cyclical factors, was in line with developments in economic indicators, notably survey data (see Chart A). Both the composite output Purchasing Managers’ Index (PMI) and the European Commission’s Economic Sentiment Indicator (ESI) declined throughout the first quarter of 2018. However, it is important to note that, like output growth, these indicators fell back from exceptionally high levels.
Chart A
Euro area real GDP, the Economic Sentiment Indicator and the composite output Purchasing Managers’ Index
(left-hand scale: diffusion index; right-hand scale: quarter-on-quarter percentage growth)

Sources: Eurostat, European Commission, Markit and ECB.
Notes: The ESI is standardised and rescaled to have the same mean and standard deviation as the PMI. The PMI covers manufacturing and services, whereas the ESI also covers the construction and retail trade sectors as well as consumer confidence. The latest observations are for the first quarter of 2018 for real GDP and May 2018 for the ESI and the PMI.
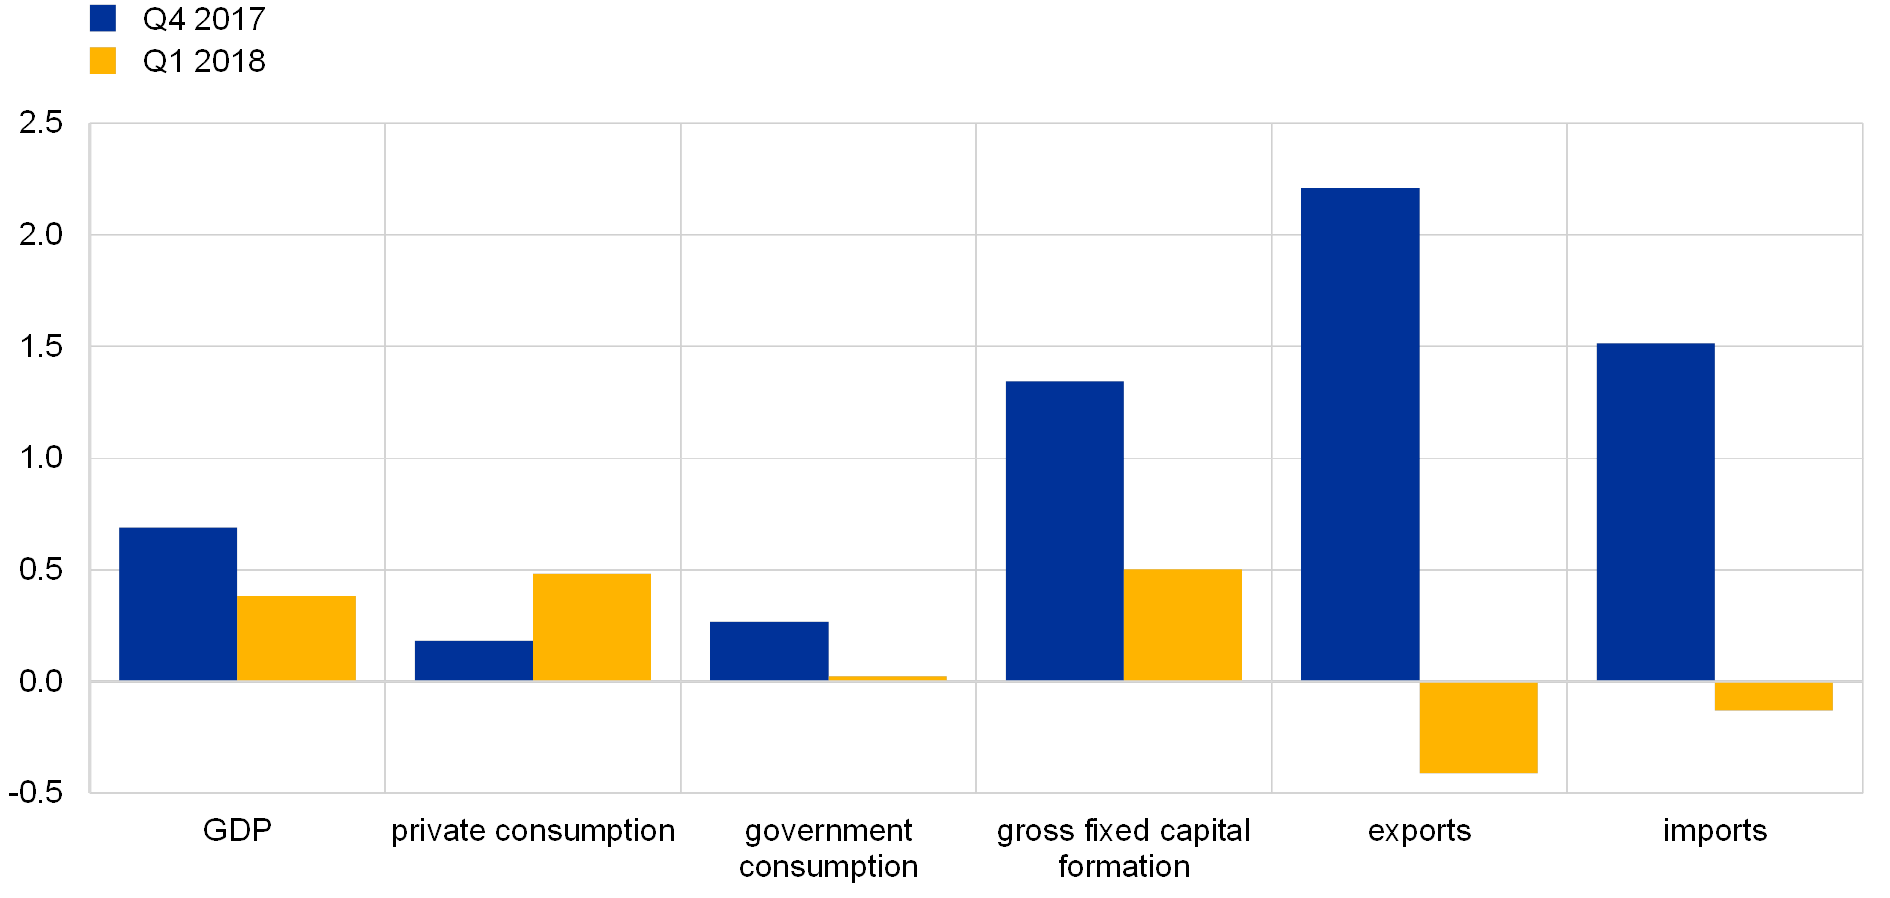
The moderation in growth in the first quarter was relatively broad-based, mainly reflecting lower exports. The slowdown in growth between the last quarter of 2017 and the first quarter of 2018 was broad-based across most euro area countries (see Chart B). Of the largest euro area countries, the only exceptions were Spain and Italy, where growth rates remained broadly stable between the two quarters. Looking at the euro area expenditure breakdown, the slowdown in growth reflects lower export growth and, to a lesser extent, lower investment growth. While the slowdown in investment growth was driven by developments in a few countries, the lower growth in exports was broad-based (see Chart C).
Chart B
Real GDP in the euro area
(quarter-on-quarter percentage growth)

Sources: Eurostat and ECB calculations.
Note: GDP for the first quarter of 2018 is not yet available for Ireland and Luxembourg.
The slowdown in growth at the start of the year appears to partly reflect temporary factors. Temporary effects are likely to have played a role in the weakness of the recent economic data releases. For example, high levels of sick-leave due to the unusually virulent influenza season in countries like Germany hampered growth. Meanwhile, cold winter weather conditions and industrial strikes in some euro area countries may also account for some of the weakness in the retail and construction sectors.
However, factors of a more lasting cyclical nature may have also played a role in the decline in growth. First, some of the slowdown in GDP growth may have been associated with increasing supply-side constraints in some countries. Second, indicators of global trade growth point to a modest deceleration in the first months of this year. This probably reflects a temporary decline in foreign demand and lagged effects of the euro appreciation in 2017, but it cannot be excluded that part of this decline was also driven by a deterioration in expectations resulting from the ongoing tariff discussions. Third, the moderation in growth in industrial production excluding construction was broad-based across euro area countries, and there are some signs of weakness in the early industrial production data releases for the second quarter of 2018. Fourth, there is growing evidence that the automotive sector may have reached its peak. This is partly confirmed by new passenger car registrations, which seem to have plateaued following a steady increase since the beginning of 2013. Furthermore, the decline in growth may have been compounded by an increase in uncertainty.
Chart C
Composition of euro area real GDP
(quarter-on-quarter percentage growth)

Source: Eurostat.
However, from a long-term perspective, the ongoing recovery is by no means exceptional in terms of length or strength. The duration of the current expansion, which began in 2013, is still below the historical average for most euro area economies (see Chart D, left-hand panel). The amplitude (percentage gain in GDP relative to the trough) during the ongoing expansion is also low by historical standards. There is also, in principle, scope for further employment growth, as the unemployment rate remains elevated in some euro area countries. Nonetheless, consumer confidence in the euro area remains close to record highs, partly on account of reduced job insecurity. Furthermore, euro area real investment remains below its pre-crisis level. Business investment has only recently recovered to levels similar to those recorded prior to the financial crisis, and public investment remains subdued.
Chart D
Euro area real GDP: characteristics of the current expansion from a historical perspective (trough-to-peak)
(quarters; percentages of GDP)

Sources: OECD, Eurostat, CEPR and ECB calculations.
Notes: Expansion is the phase of the business cycle where the economy is moving from a trough to a peak. The chronology of expansions for the euro area comes from the Centre for Economic Policy Research (CEPR). For the five big euro area countries, it is calculated using quarterly real GDP and the Bry-Boschan algorithm. The blue bars correspond to the current expansion and the yellow bars to the average duration or amplitude of expansions in each country since 1970. The current expansion began in the first quarter of 2013 for the euro area, Germany and Italy, the fourth quarter of 2012 for the Netherlands, the third quarter of 2013 for Spain, and the second quarter of 2009 for France, and extends to the most recent GDP observation (first quarter of 2018).
Overall, the economic expansion should remain solid, supported by the underlying strength of the euro area economy. Although survey results have again moderated somewhat, they remain consistent with further solid growth. Going forward, the solid growth is expected to continue, albeit possibly at lower rates, as the ECB’s monetary policy measures continue to underpin domestic demand. Private consumption should continue to be supported by employment gains and rising household wealth. Investment is expected to strengthen further on the back of very favourable financing conditions, rising corporate profitability and solid demand. In addition, the broad-based global expansion is providing impetus to euro area exports.
Europos Centrinis Bankas
Komunikacijos generalinis direktoratas
- Sonnemannstrasse 20
- 60314 Frankfurtas prie Maino, Vokietija
- +49 69 1344 7455
- media@ecb.europa.eu
Leidžiama perspausdinti, jei nurodomas šaltinis.
Kontaktai žiniasklaidai

