COVID-19 and the increase in household savings: an update
Published as part of the ECB Economic Bulletin, Issue 5/2021.
This box analyses the increase in euro area household savings since the start of the coronavirus (COVID-19) crisis. It provides an update of an earlier analysis of the drivers of the recent surge in savings and what they imply for the adjustment of savings and the recovery in private consumption as the pandemic is brought under control.[1] Since the pandemic has mainly affected euro area economic activity through restrictions imposed on several types of consumption, the nature of the recovery in this demand component will largely determine how fast overall economic activity recovers.
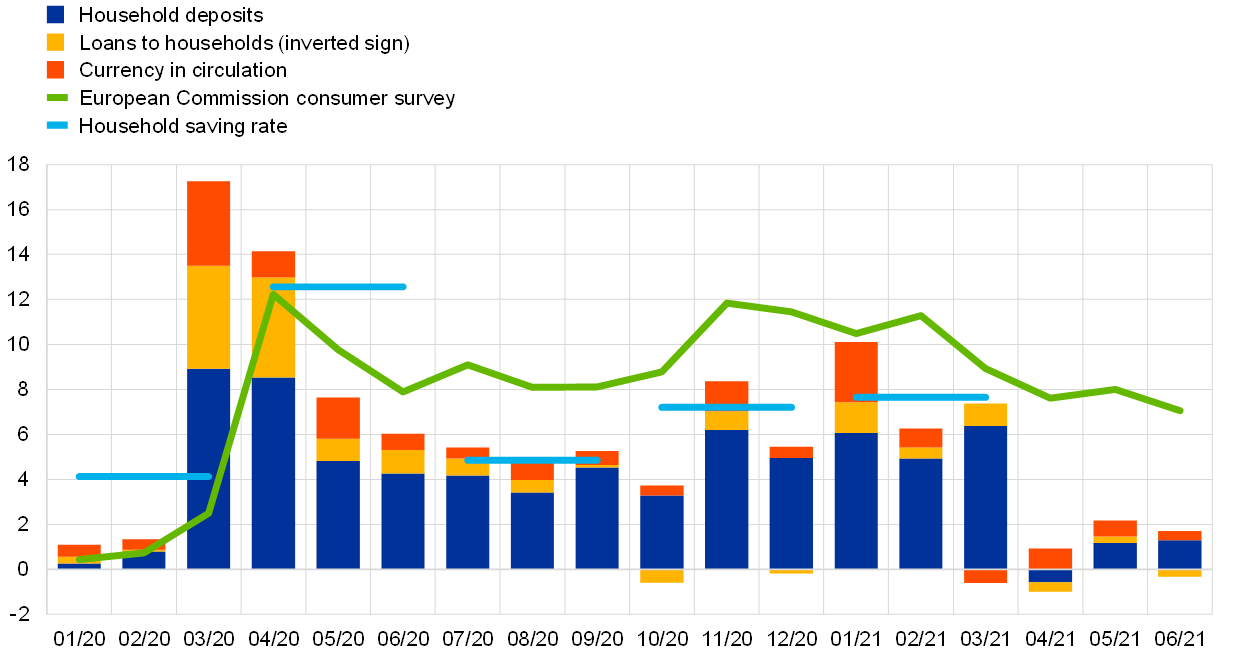
The propensity of euro area households to save has reached extraordinary levels since early 2020. The household saving rate, as derived from the euro area sectoral accounts (see Chart A), increased sharply in the first half of 2020. Since then it has fluctuated around a much higher level than before the pandemic, largely mirroring the pandemic-induced decline in consumption. The sectoral accounts are released with a lag of about three months; therefore, more timely indicators, such as monthly information on household bank deposits and loans, have been important as they have provided early information for assessing savings dynamics. These indicators show that a substantial part of the additional household savings was accumulated in the form of bank deposits and lower household borrowing. Information from the European Commission’s consumer survey about households’ intentions with regard to savings in the next 12 months has also proven useful for gauging ongoing developments. While these indicators give advance information on the size of fluctuations, a thorough understanding of the underlying drivers depends on more detailed information provided in the sectoral and national accounts.
Chart A
Indicators of household savings
(change with respect to December 2019/Q4 2019, percentage points of disposable income and percentage points)
Sources: European Commission’s DG-ECFIN, Eurostat, ECB and authors’ calculations.
Notes: Household deposits and loans refer to net flows. Loans to households are reported with an inverted sign. The contribution of currency flows is considered an upper bound, as a breakdown by holding sector is not available on a monthly basis. The latest observation is for the first quarter of 2021 for the household saving rate and for June 2021 for all other series. The data are seasonally adjusted.
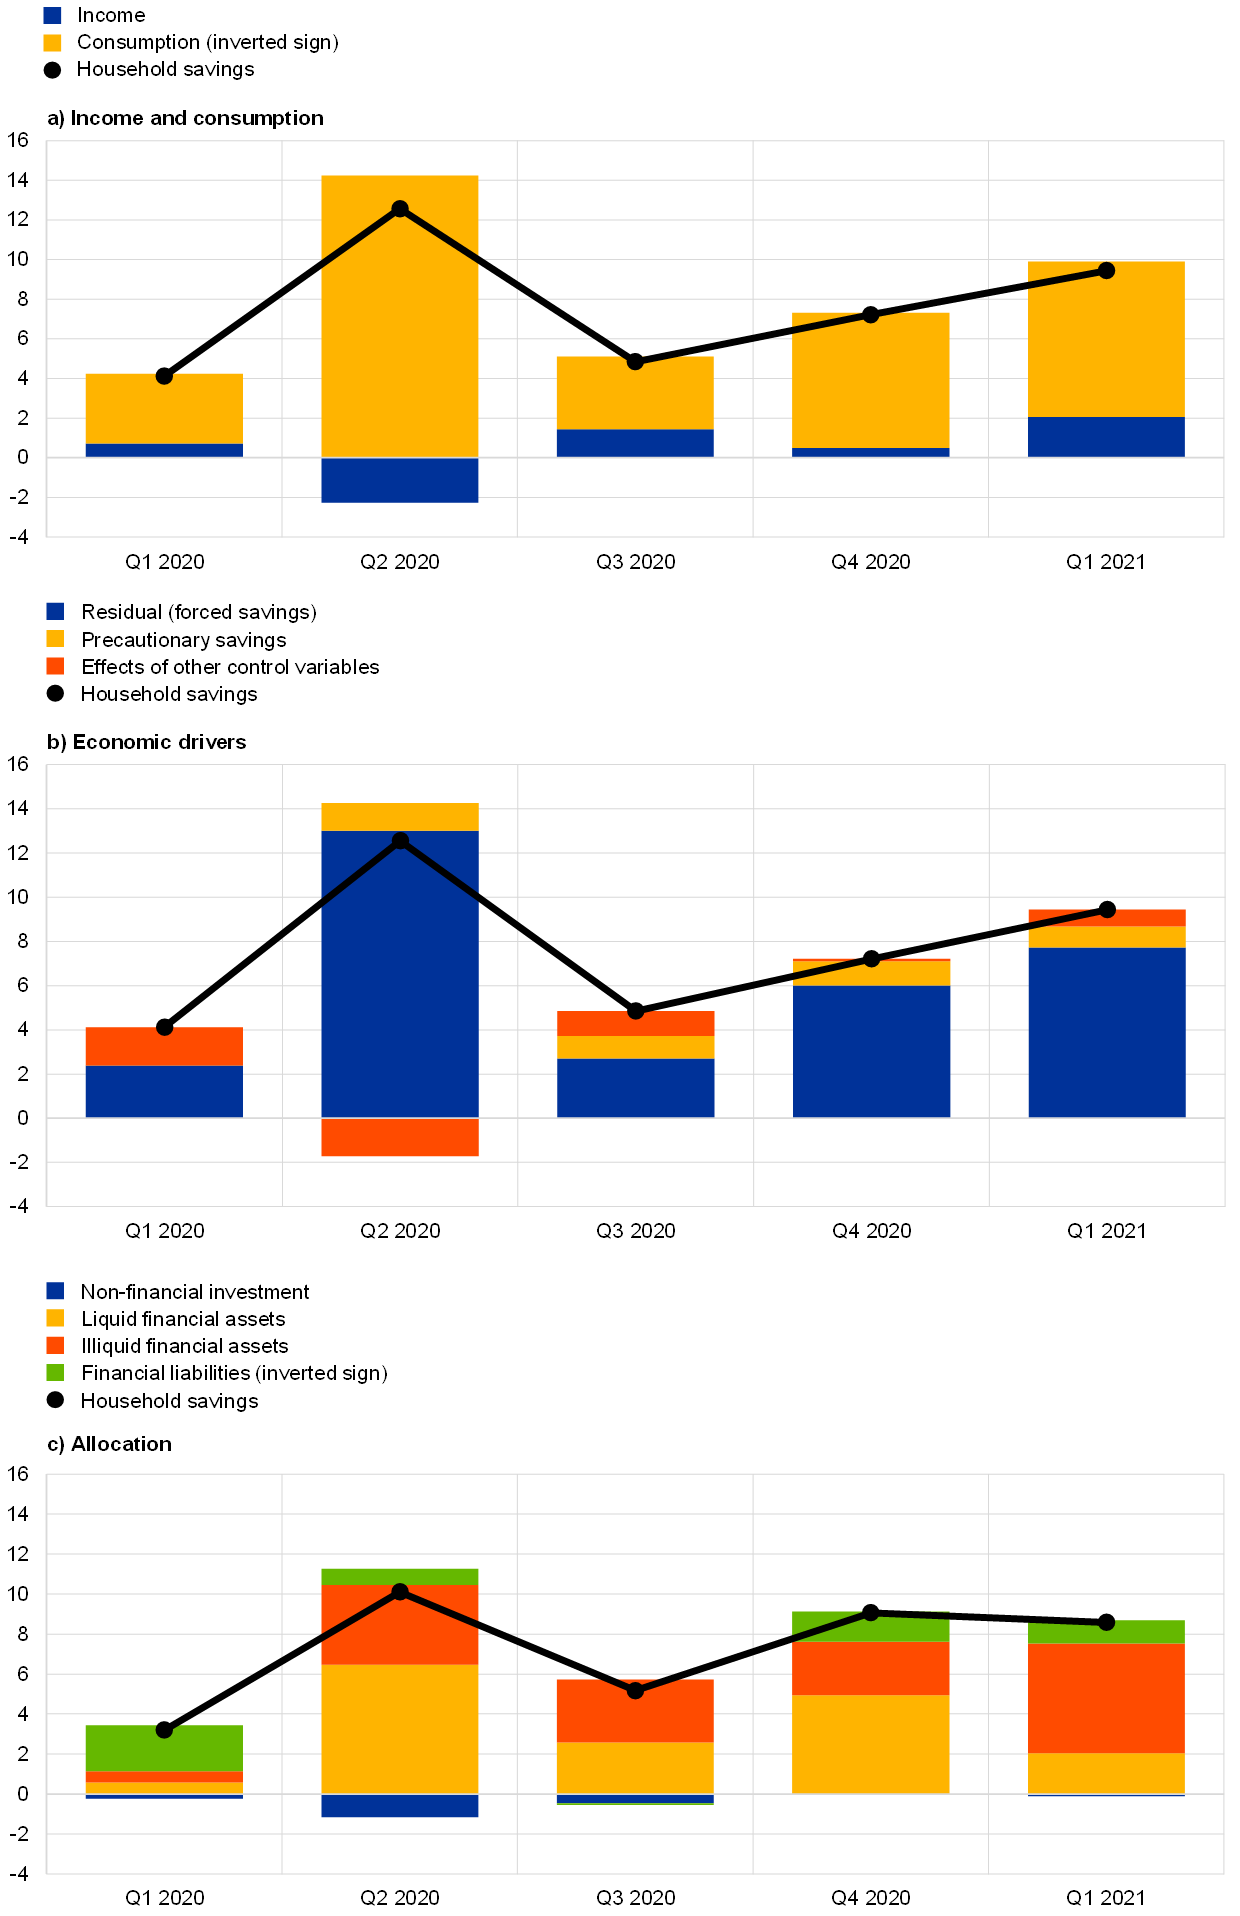
The higher savings largely reflect lower consumption, as fiscal transfers have stabilised household sector income. Chart B (panel a) illustrates how the surge in household savings mainly reflects lower consumption. Aggregate household income has been largely insulated from the contraction in economic activity as a result of large fiscal transfers. This is very different from developments during the two previous euro area recessions, when real disposable income declined significantly despite a much smaller drop in compensation of employees. At the same time, euro area real disposable income has not increased during the current crisis, unlike in some other advanced economies where fiscal transfers have given an additional boost to household disposable income (for details, see Box 1 in this issue of the Economic Bulletin). This is due to the more targeted nature of income support in the euro area (e.g. short-time work schemes), which has been largely conditional on households experiencing an effective drop in hours worked and thus in their labour income.[2]
Chart B
Household saving rate: three decompositions
(panels a and b: change with respect to Q4 2019, panel c: change with respect to corresponding quarter in 2019; percentage points of disposable income and percentage point contributions)
Sources: Eurostat and authors’ calculations.
Notes: Panels a and b both use seasonally adjusted data and show the change in the saving rate with respect to the fourth quarter of 2019; panel c uses non-seasonally adjusted data and shows the change in the saving rate with respect to the corresponding quarter of 2019. The saving rate in panel c differs somewhat from the saving rate in panels a and b owing to statistical discrepancies between the non-financial and financial accounts, as well as a different reference quarter owing to the use of non-seasonally adjusted data.
The increase in household savings has been largely involuntary. The decomposition shown in Chart B (panel b) suggests that most of the additional savings were involuntary. Owing to the government-imposed restrictions and the fear of infection, many types of consumption were effectively not available (e.g. restaurant visits, concerts and travel), leading to involuntary or “forced” savings. Precautionary savings have also played a significant, albeit more limited, role. Short-time work schemes not only provided immediate compensation for the loss of labour income, but also helped to preserve existing jobs. The nature of these fiscal transfers also seems to have contributed to containing the risk of future loss of income and hence the need for precautionary savings, although this effect is hard to quantify.[3]
A large part of the increase in savings has been held in liquid assets. Chart B (panel c) shows that about half of the increase in household savings has been placed in liquid financial assets (i.e. cash and bank deposits). For this reason, recent developments in the saving rate are captured quite well by changes in household deposit flows (see Chart A). At the same time, it should also be noted that a great deal of the additional savings has been invested in less liquid forms, such as equity and investment funds, or has been used to reduce household borrowing. Nevertheless, with a large part of the additional savings being held in liquid form, owing to the involuntary contraction in consumption and broadly stable (aggregate) household income, this raises the question of the extent to which the unwinding of the accumulated excess savings (i.e. the amount of savings that exceeds the pre-pandemic level) can provide an additional boost (by funding pent-up demand) to the recovery in private consumption.[4] This question is addressed below.
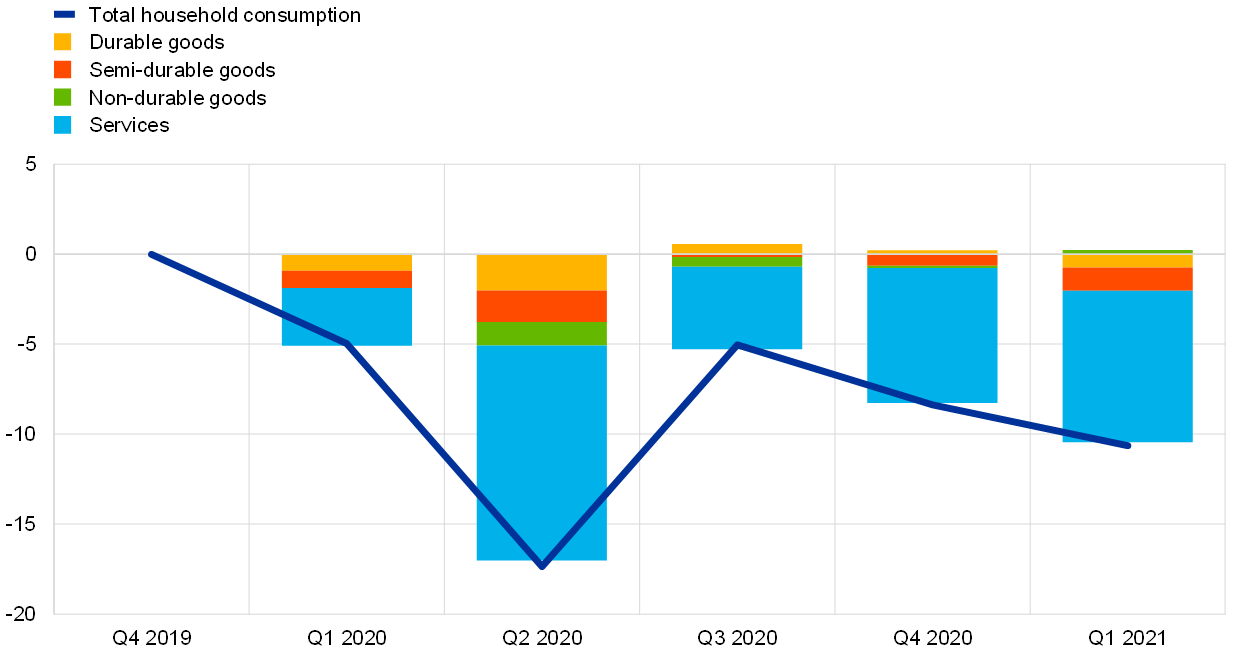
The decline in consumption mainly reflects a drop in consumption of consumer services. The initial decline in consumption during the first wave of the pandemic and the renewed declines during subsequent waves were dominated by lower expenditure on services to a larger extent than in previous recessions (see Chart C). This reflected the distinctive nature of the pandemic, including the imposition of social distancing measures. When lockdowns were temporarily relaxed in the third quarter of 2020, spending on durable goods bounced back to pre-pandemic levels, but the recovery in services remained subdued. The services-led nature of the slump in consumption during the pandemic implies less scope for pent-up demand effects after the health crisis is resolved.[5] While the recovery remains heavily dependent on a rebound in services, which are less prone to pent-up demand effects, this could be counterbalanced to some extent by substitution in favour of durable goods consumption.[6]
Chart C
Developments in euro area private consumption
(change with respect to Q4 2019, percentage points)
Sources: Eurostat and authors’ calculations.
Notes: The latest observation is for the first quarter of 2021. All data are deflated and seasonally adjusted.
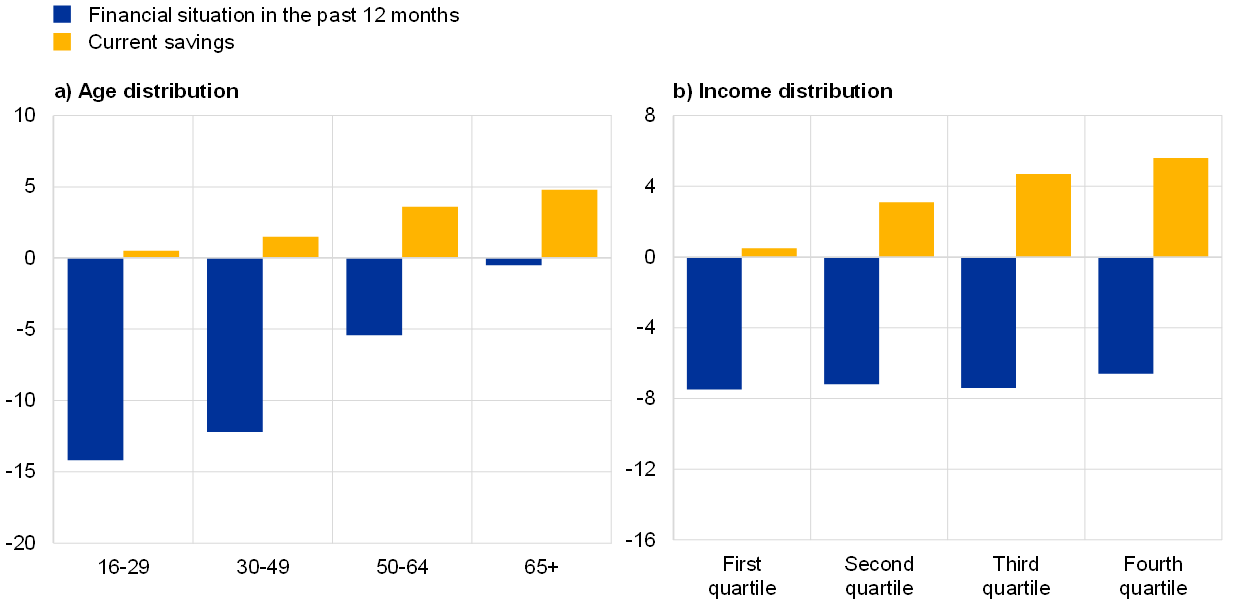
The accumulation of savings during the pandemic has been concentrated among older and higher-income households. Chart D suggests that savings increased mostly among older and higher-income households, which is in line with the findings of several studies.[7] First, both groups of households were generally less exposed to losses in labour income, as they are either inactive or work in sectors less exposed to the effects of social distancing.[8] Second, their consumption basket contains more services that have seen a drop in consumption owing to social distancing measures.[9] As older and higher-income households are generally less liquidity constrained (or have lower marginal propensities to consume), the extent to which these additional savings will be turned into consumption can be expected to be relatively low. In addition, under Ricardian equivalence they may also be more concerned about future tax increases to offset the recent rise in government debt.
Chart D
Household financial situations and savings across the age and income distributions
(change in percentage balance – December 2019-April 2021)
Sources: European Commission’s DG-ECFIN and authors’ calculations.
Notes: The revision in households’ financial situation and their ability to save is proxied by the change in net balances between December 2019 and April 2021.The latest observation is for April 2021, so as to cover the period of increased savings (cf. Chart A). All data are seasonally adjusted.
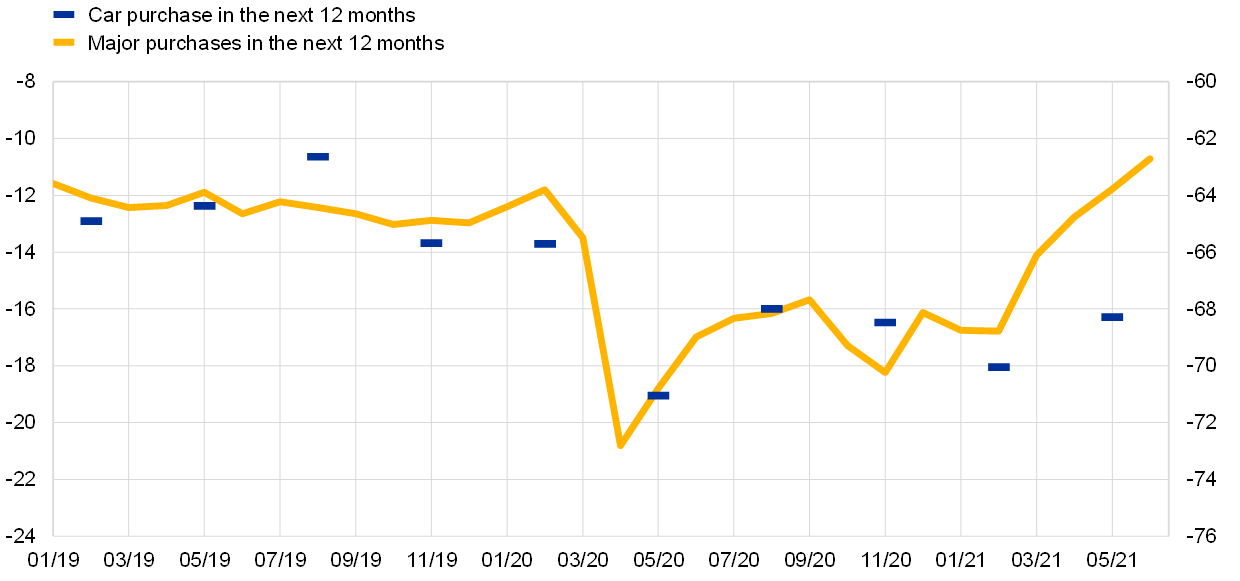
Survey indicators suggest no immediate surge will occur in private consumption. The European Commission’s consumer survey (see Chart E) suggests that in the next 12 months households expect their spending on major purchases (e.g. furniture, electrical/electronic devices, etc.) to be comparable to the amounts they spent at the beginning of 2020. Households also indicated that their intentions to purchase a car in the next 12 months remain below pre-COVID levels. While some expenditure categories may be benefiting from exceptionally high demand, survey indicators do not signal that in the coming year widespread pent-up demand financed by excess savings accumulated during the pandemic will give a strong boost to private consumption.
Chart E
Household spending expectations
(percentage balance)
Source: European Commission’s DG-ECFIN.
Notes: The latest observation is for June 2021 for major purchases and the second quarter of 2021 for car purchases. All data are seasonally adjusted.
The COVID-19 shock has led to a surge in household savings, but its drivers do not suggest a large additional boost to the expected rebound in consumption. The COVID-19 pandemic has generated an economic shock that has affected private consumption and household savings in a complex way. While several factors suggest that the accumulated excess savings could be reabsorbed easily for consumption purposes, other factors suggest that this may not be so straightforward. Overall, the likelihood of an immediate reabsorption of accumulated excess savings for future consumption purposes remains limited.[10]
- See the box entitled “COVID-19 and the increase in household savings: precautionary or forced?”, Economic Bulletin, Issue 6, ECB, 2020.
- See the box entitled “Short-time work schemes and their effects on wages and disposable income”, Economic Bulletin, Issue 4, ECB, 2020.
- See Bayer, C., Born, B., Luetticke, R. and Mueller, G. (2020), “The Coronavirus Stimulus Package: How large is the transfer multiplier?”, CEPR Discussion Paper, No 14600.
- Excess savings can be quantified as the amount by which household savings during the pandemic exceeded a counterfactual path without the COVID-19 pandemic. Using the saving rate path from the Eurosystem staff macroeconomic projections for the euro area, December 2019, as a counterfactual path, the accumulated amount of excess savings can be estimated at €540 billion in the first quarter of 2021, or 7.4% of annual disposable income in 2019 (see the box entitled “Household saving ratio dynamics and implications for the euro area economic outlook” in the Eurosystem staff macroeconomic projections for the euro area, June 2021). Bilbiie et al. (2021) use the pre-pandemic level of the saving rate as a counterfactual (see Bilbiie, F., Eggertsson, G. and Primiceri, G. (2021), “US ‘excess savings’ are not excessive”, VoxEU, 1 March). Different plausible assumptions about the counterfactual evolution of household savings in the absence of the pandemic lead to relatively small differences in the estimated amount of excess savings.
- See Beraja, M. and Wolf, C. (2021), “Demand Composition and the Strength of Recoveries”, Massachusetts Institute of Technology, mimeo. While the concept of pent-up demand is often used in the context of durable goods, such effects could also be present in expenditure on services. For instance, there might be “memorable” services related to tourism and travel which could trigger the materialisation of strong latent demand – see Hai, R., Krueger, D. and Postlewaite, A. (2020), “On the welfare cost of consumption fluctuations in the presence of memorable goods”, Quantitative Economics, Econometric Society, 11(4), 1177-1214.
- The rebound in durable goods consumption in the third quarter of 2020 might have reflected in part temporary factors. For instance, the expenditure on durables might have been supported by one-off purchases of home appliances to adapt to teleworking in a “home office” environment. Moreover, the temporary VAT cut in Germany in the second half of 2020 is likely to have brought durable goods purchases forward, as evidenced by the renewed weakness in durable goods consumption following the expiration of the VAT cut in the first half of 2021 – see Clemens, M. and Röger, W. (2021), “Temporary VAT reduction during the lockdown”, DIW Discussion Paper, No 1944.
- See Bounie, D., Camara, Y., Fize, E., Galbraith, J., Landais, C., Lavest, C., Pazem, T. and Savatier, B. (2020), “Consumption Dynamics in the COVID Crisis: Real Time Insights from French Data”, London School of Economics, mimeo; Hacioglu, S., Känzig, D. and Surico, P. (2021), “The distributional impact of the pandemic”, CEPR Discussion Paper, No 15101; Friz, R. and Morice, F. (2021), “Will consumers save the EU recovery? – Insights from the Commission’s consumer survey”, SUERF Policy Note, No 237, May.
- Developments in the financial situation of households across the income distribution were similar, given that income support was mainly targeted at lower-income households who have been more exposed to sectors that needed to reduce activity.
- See the box entitled “COVID-19 and income inequality in the euro area”, in the article entitled “Monetary policy and inequality”, Economic Bulletin, Issue 2, ECB, 2021.
- For a discussion of how the adjustment in the saving rate and in accumulated excess savings shapes the outlook for the euro area economy, see Box 2 in the Eurosystem staff macroeconomic projections for the euro area, June 2021.


