Published as part of the ECB Economic Bulletin, Issue 4/2024.
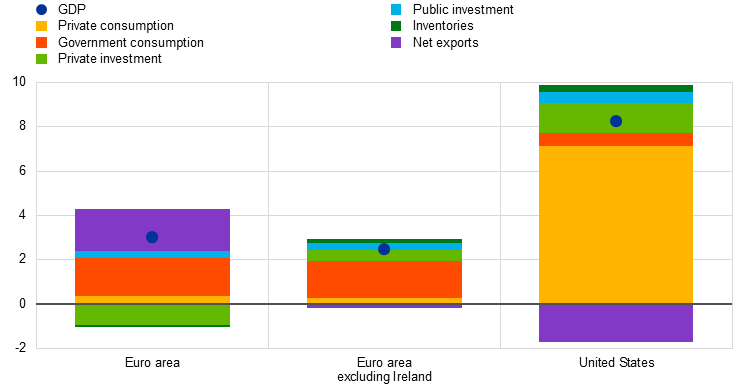
Real GDP growth has been notably weaker in the euro area than in the United States since the start of the pandemic.[1] Between the fourth quarter of 2019 and the fourth quarter of 2023, the euro area economy grew by around 3% in cumulative terms, while real GDP in the United States rose by more than 8% (Chart A), resulting in a cumulative growth differential of around 5 percentage points.[2] This gap is primarily attributable to weaker private consumption in the euro area than in the United States, where direct income support and a relatively larger reduction in excess savings provided a particularly strong boost. The euro area suffered a substantial terms-of-trade shock after the invasion of Ukraine sparked an energy crisis. While there is mixed evidence of the relative size of monetary policy impacts across these two regions, fiscal policy support may have been stronger in the United States relative to the intensity of the various shocks, albeit different reporting conventions make comparisons harder to draw. This box examines these and other contributing factors; it does not assess the diverging underlying structural growth trends prior to the pandemic.[3]
A breakdown by expenditure component shows that buoyant private consumption growth in the United States accounts for most of the growth gap (Chart A). Private consumption contributed around 7 percentage points to the difference in growth between the euro area and the United States from the onset of the pandemic until the fourth quarter of 2023. Particularly volatile investment and trade in intangibles in Ireland notably affected the euro area, weighing on investment and boosting net exports in the euro area over this period. At the same time, private investment was stronger in the United States than in the euro area – even when adjusted for Irish intangibles and despite a fall in US housing investment. By contrast, the contribution from net trade to growth was still more negative in the United States than in the euro area after adjusting for intangible-intensive Irish trade, owing to strong demand-driven imports to the United States. Public investment grew marginally less in the euro area, although levels were much higher than in previous years thanks to support from the Next Generation EU programme. Meanwhile, government consumption contributed more to GDP growth in the euro area than in the United States.
Chart A
Euro area and US real GDP growth
(cumulative percentage changes and contributions, Q4 2019-Q4 2023)

Sources: Eurostat, Bureau of Economic Analysis and ECB calculations.
Notes: Euro area public investment is proxied as total real investment minus the sum of the four-quarter moving averages of non-seasonally adjusted nominal investment by non-financial corporations, financial corporations and households from the ECB and Eurostat’s quarterly sector accounts dataset, deflated by the total investment deflator. The latest observations are for the fourth quarter of 2023.
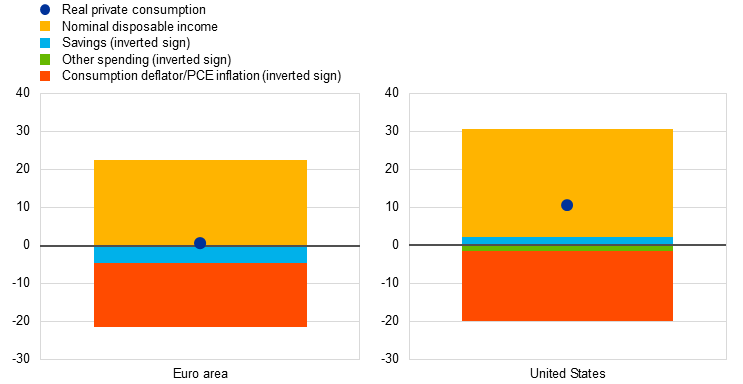
The pandemic shock seems to have had a greater impact on euro area real growth than US real growth in recent years.[4] Since the start of the pandemic, consumer spending has proved stronger in the United States than in the euro area. Among other factors, this reflects the fiscal policy response to the pandemic in 2020 coupled with a robust labour market thereafter, which served to boost disposable income more sharply in the United States (Chart B). Excess savings – compared with pre-pandemic trends – built up in both regions. While remaining elevated in the euro area, the faster unwinding of excess savings in the United States provided strong support to US private consumption in 2022 and 2023 (Chart B). The composition of assets reflected in excess savings discouraged spending in the euro area as, in contrast to US consumers, euro area households had accumulated relatively small holdings of liquid assets.[5] Had these households reduced their savings rate by the same amount as their US counterparts in the post-pandemic period, all else equal, the cumulative consumption growth differential would have been around 3 percentage points instead of the 10 percentage points actually recorded since the fourth quarter of 2019.
Chart B
Euro area and US private consumption, income and savings
(cumulative percentage changes and contributions, Q4 2019-Q4 2023)

Sources: Eurostat, Bureau of Economic Analysis and ECB calculations.
Notes: Other spending refers to interest and transfer payments. PCE stands for the Personal Consumption Expenditures price index.
The euro area economy has also been more heavily affected by the fallout from Russia’s war against Ukraine. The economic impact of Russia’s invasion of Ukraine in early 2022 as well as the ensuing energy crisis and food inflation spikes had a particularly severe impact on the euro area economy. This can be attributed to geographical proximity, the level of dependence on energy and food imports from this region and the adverse impact on euro area consumer confidence. The substantial terms-of-trade losses intensified as the euro depreciated both against the US dollar and in effective terms, i.e. relative to a basket of currencies (Chart C, panel a).[6] By contrast, the terms of trade in the United States were much more stable, mainly reflecting its greater degree of energy independence. In the euro area, the sizeable terms-of-trade shock resulted in lower real incomes and weaker competitiveness, in a context of declining confidence and rising uncertainty. This served to dampen private consumption, particularly of goods. While services activity was spurred by reopening effects in both regions, services output growth was stronger in the United States. Moreover, the euro area’s greater trade openness meant that its manufacturing sector was particularly exposed to supply bottlenecks and the global slowdown (Chart C, panel b).
Chart C
Euro area and US terms of trade and trade openness
a) Terms of trade | b) Trade openness |
|---|---|
(percentage change and contributions) | (percentage share of output) |
 |  |
Sources: Eurostat and Bureau of Economic Analysis.
Notes: Panel b) shows the sum of real extra euro area exports and imports as a share of real output in 2023, reflecting larger euro area engagement in the global trading system and hence a higher sensitivity of activity to trade in the euro area than in the United States. The latest observations in panel a) are for the fourth quarter of 2023, whereas the observations in panel b) are for 2023.
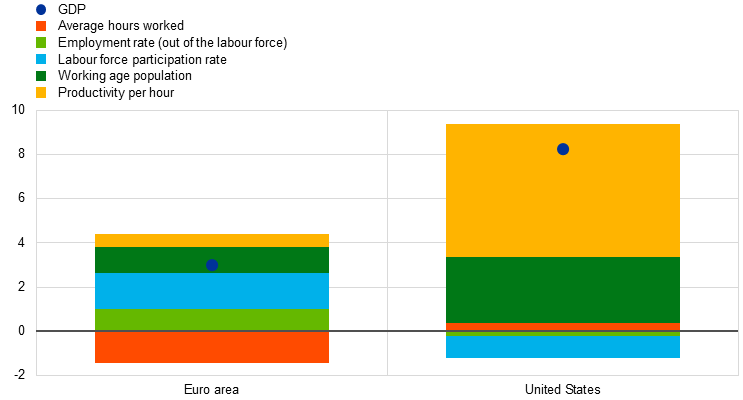
The United States has experienced significantly stronger labour productivity growth than the euro area since the pandemic. A decomposition of GDP growth into labour productivity, labour market outcomes and demographic trends shows a particularly large difference in labour productivity (Chart D). In the period since the pandemic first emerged, labour productivity per hour worked has increased by just 0.6% in the euro area against 6.0% in the United States. This divergent path in productivity growth began in the second quarter of 2020, as total labour input as a share of GDP adjusted more strongly in the United States than in the euro area. This was due in part to the implementation of job retention schemes in the euro area as opposed to surging unemployment in the United States. After briefly narrowing, this gap in productivity growth started widening again after mid-2022 as euro area productivity growth was depressed by the energy shock. Sectoral developments played an important role in productivity growth in the euro area, with the construction sector in particular making a negative contribution to hourly productivity growth. At the same time, ICT and professional services contributed strongly to productivity growth in the United States. In addition, labour productivity tends to be much more cyclical in the euro area than in the United States. This leads to lower productivity growth in times of low output growth (as is currently the case in the euro area) and higher productivity growth when the economy rebounds.[7] Strong population growth in the United States, mainly reflecting rising immigration, was partly offset by a fall in the overall participation rate. In terms of contributions to GDP growth in the euro area in this period, the expanding labour force, driven by a larger increase in participation rates and an influx of migrant workers, was partly offset by a decline in average hours worked. In the euro area, the increase in the labour force was paralleled by a higher employment rate, which also contributed to GDP growth.
Chart D
Real GDP growth and the labour market
(cumulative percentage changes and contributions, Q4 2019-Q4 2023)

Sources: Eurostat and Bureau of Economic Analysis.
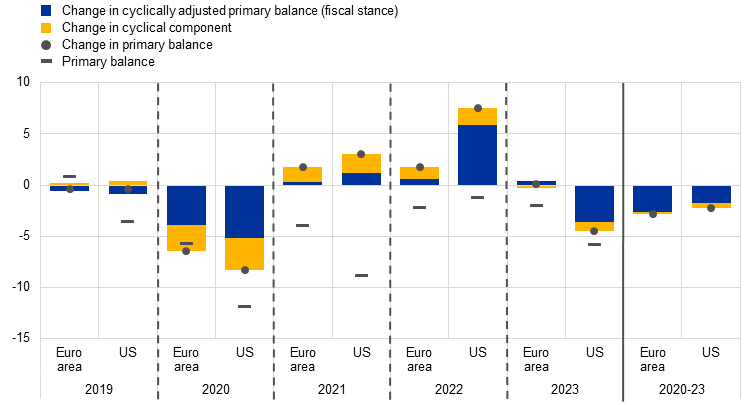
Compared with a scenario of no fiscal policy support, discretionary fiscal policy is estimated to have contributed positively to growth in both regions overall, although it is hard to draw accurate comparisons.[8] At the peak of the pandemic in 2020, the discretionary policy response helped to dampen the effects of the pandemic shock. The stimulus (as proxied by the change in the cyclically adjusted primary balance in 2020 compared with 2019) was substantial in both regions, albeit stronger in the United States at over 5% of GDP compared with 4% of GDP in the euro area (Chart E). In terms of composition, broad-based and relatively large household income measures in the United States supported private consumption, while fiscal stimulus in the euro area was more targeted towards supporting employment, including through job retention schemes.[9] The fiscal stance tightened in both regions in 2021 and 2022, but more so in the United States than in the euro area.[10] In 2022, as the energy crisis started to unfold in the euro area, governments adopted significant measures to lower energy prices and support incomes, amounting to close to 2% of GDP; at the same time, the fiscal position consolidated significantly more in the United States, reflecting the unwinding of pandemic-era support measures, among other factors. In 2023, the fiscal position loosened again in the United States, driven by shortfalls in capital gains tax receipts as well as discretionary measures, including those measures under the Inflation Reduction Act that support manufacturing investment. All in all, while the cumulative fiscal impulse over 2020-23 was similar across the two regions, it was in response to shocks that were more significant in the euro area. Moreover, given a significantly higher primary deficit in the United States prior to the pandemic (and inertia in spending), the United States accumulated much larger primary deficits (and debt) over this period than the euro area, particularly during 2020-21 and in 2023.[11]
Chart E
Fiscal impulse – contributions from fiscal stance and cyclical conditions – and overall primary balances
(percentage points of GDP, percentages of GDP)

Source: IMF April 2024 World Economic Outlook.
Notes: Fiscal stance is a proxy for the discretionary fiscal policy response. Fiscal impulse (change in the primary balance) additionally includes the automatic stabilisers (change in the cyclical component). Negative (positive) changes denote fiscal loosening (tightening). The last panel shows cumulative changes over the period 2020-23. The primary balance is expressed as a percentage of GDP. The outcome for 2023 is preliminary and subject to revisions.
Turning to monetary policy, there is mixed evidence of its relative impact in the two regions. Both regions saw a broadly similar degree of monetary policy tightening and a strong transmission to lending rates in the private sector. However, the impact across expenditure components was mixed.[12] The transmission of monetary policy changes is surrounded by high levels of uncertainty[13] and depends heavily on the financial structures in place, with, for example, a lower share of fixed-rate mortgages and corporate debt, less important wealth effects,[14] as well as a higher reliance on the banking system, in the euro area than in the United States. For instance, there is some evidence that the pass-through was more significant to business investment in the euro area, while the impact on housing investment was larger in the United States.[15] In addition, US monetary policy shocks tend to have a significant adverse impact on euro area financial conditions and real activity, whereas euro area monetary policy shocks do not have a similar effect on the United States.[16]
Looking ahead, the latest Eurosystem staff macroeconomic projections point to a smaller growth differential between the euro area and the United States over the next two years. In contrast to the United States, real GDP growth in the euro area is expected to accelerate on the back of relatively stronger consumption.[17] The productivity growth gap is also projected to shrink, with a stronger recovery in labour productivity in the euro area, due in part to some cyclical unwinding of labour hoarding.
See also de Soyres, F., Garcia-Cabo Herrero, J., Goernemann, N., Jeon, S., Lofstrom, G., and Moore, D., “Why is the U.S. GDP recovering faster than other advanced economies?”, FEDS Notes, Board of Governors of the Federal Reserve System, Washington, 17 May 2024.
Excluding data on volatile Irish intangibles – see the box entitled “Intangible assets of multinational enterprises in Ireland and their impact on euro area GDP”, Economic Bulletin, Issue 3, ECB, 2023 – the growth differential between the euro area and the United States in the same period is.5.7 percentage points.
An analysis of the structural factors behind the US-euro area growth differentials over past decades − such as the less favourable economic structures for the euro area (i.e. structures of production and consumption, and sectoral regulations and policies that determine the incentives of economic actors to invest, consume and trade within and across borders), lower R&D spending, less innovation and adoption of digital technologies, lower growth potential, higher government funding costs and harder access to credit − is outside the scope of this box.
See the box entitled “Economic developments in the euro area and the United States in 2020”, Economic Bulletin, Issue 2, ECB, 2021.
See the box entitled “The consumption impulse from pandemic savings ‒ does the composition matter?”, Economic Bulletin, Issue 4, ECB, 2023.
See the box entitled “Implications of the terms-of-trade deterioration for real income and the current account”, Economic Bulletin, Issue 3, ECB, 2022.
See Arce, O. and Sondermann, D., “Low for long? Reasons for the recent decline in productivity”, The ECB Blog, ECB, 6 May 2024.
Comparable estimates for the size and composition of discretionary measures (beyond the fiscal stance), as well as their impact on growth, are not readily available. For the euro area, see the box entitled “The impact of discretionary fiscal policy measures on real GDP growth from 2020 to 2022” in the article “The role of supply and demand in the post-pandemic recovery in the euro area”, Economic Bulletin, Issue 4, ECB, 2023. For 2023 the impact of discretionary fiscal policy measures on growth is estimated to be moderately negative.
See the box entitled “Economic developments in the euro area and in the United States in 2020”, Economic Bulletin, Issue 2, ECB, 2021. For an analysis of the euro area, see also the box entitled “Short-time work schemes and their effects on wages and disposable income”, Economic Bulletin, Issue 4, ECB, 2020.
Discretionary stimulus measures continued in the euro area in 2021, particularly for government consumption (including healthcare spending) and subsidies (job retention schemes and other support to firms). Significant non-discretionary factors, mostly revenue windfalls, contributed to the tightening of the fiscal stance shown in Chart E.
According to the IMF’s April 2024 World Economic Outlook, the cumulative primary deficits over 2020-23 were 28% of GDP in the United States compared with 14% of GDP in the euro area. Over the same period, the government debt-to-GDP ratio increased in the United States by 14 percentage points (to 122.1% in 2023) compared with 5 percentage points in the euro area (to 88.6% in 2023). Data for 2023 are still preliminary and subject to revisions.
See “The analytics of the monetary policy tightening cycle”, guest lecture by Philip R. Lane, Member of the Executive Board of the ECB, Stanford, 2 May 2024.
See “The transmission of monetary policy”, speech by Philip R. Lane, Member of the Executive Board of the ECB, New York, 11 October 2022.
Sectoral accounts data show a higher share of financial wealth, and a higher propensity to consume such wealth, in the United States than in the euro area. See also the box entitled “The consumption impulse from pandemic savings ‒ does the composition matter?”, Economic Bulletin, Issue 4, ECB, 2023.
See the box entitled “Monetary policy and housing investment in the euro area and the United States”, Economic Bulletin, Issue 3, ECB, 2023.
See Ca’ Zorzi, M. et al., “Making Waves: Monetary Policy and Its Asymmetric Transmission in a Globalized World”, International Journal of Central Banking, June 2023.
See “Eurosystem staff macroeconomic projections for the euro area, June 2024”, published on the ECB’s website on 6 June 2024.


