


Enhancing the ECB’s O-SII framework
Enhancing the ECB’s O-SII framework
Published as part of the Macroprudential Bulletin 30, August 2025.
Capital buffers for other systemically important institutions (O-SIIs) are set by national authorities across the EU Member States participating in the banking union (BU). On 1 January 2025 the ECB started using an enhanced floor methodology to assess national O-SII buffer decisions. This methodology adopts a BU perspective to address “too-big-to-fail”-related risks at the BU level. The aim is to reduce the heterogeneity in O-SII buffers and achieve a more consistent treatment of the most systemically important institutions. Furthermore, the enhanced methodology recognises the progress made on the European banking union, in line with the approach taken in the G-SIB framework. It introduces a BU floor for O-SII buffers, calibrated based on a linear function mapping O-SII scores from the BU perspective to minimum buffer rates. The enhanced methodology will be fully phased in by 2028.
1 Introduction
Starting in 2016 the ECB applied a purely national perspective in its floor methodology[2] to assess O-SII buffers proposed by national authorities. The level of O-SII buffers was assessed based on the systemic importance of individual banks for their domestic banking system. Neither the national authorities nor the ECB considered the systemic importance of individual O-SIIs for the banking union as a whole. This created a gap in the measurement and assessment of O-SII capital buffers.
O-SII buffers, as set by national authorities, vary greatly across BU countries. In its principles for assessing domestic systemically important banks, the Basel Committee on Banking Supervision suggests that the policy judgement on national O-SII buffer levels should be guided by country-specific factors like the size of the banking sector relative to GDP (see BCBS, 2012). Despite the reduction in heterogeneity which followed the introduction and subsequent revision of the ECB’s national floor, there remains unwarranted heterogeneity that are not explained by BU country characteristics or other economic factors (see, for example, ECB, 2022a, and Greco et al., 2025). Notably, the heterogeneity in O-SII buffer-setting apply to some of the most systemically important banks in the banking union (Chart 1). Furthermore, Sigmund (2021) finds that national regulators’ preferences are a relevant determinant of heterogeneity in O-SII buffers, while Dimitrov and van Wijnbergen (2023) show that banks’ contributions to systemic risk in Europe are not fully aligned with the O-SII buffers.
Chart 1
Systemic importance of O-SIIs and O-SII buffer rates from the national and BU perspectives
a) National perspective | b) Banking union perspective |
|---|---|
 |  |
Sources: ECB (supervisory data) and ECB calculations.
Notes: G-SIBs stands for global systemically important banks. Panel a) is based on a sample of about 120 O-SIIs that are designated by national authorities. Panel b) is based on a sample of 90 O-SIIs in the banking union that are at the highest level of consolidation. O-SIIs have been grouped according to the buckets of the O-SII floor from the BU perspective. The graphs show plots of the O-SII scores from the national (panel a) and the BU (panel b) perspective against the assigned O-SII buffers as at the end of 2023.
The ECB enhanced its methodology for assessing O-SII buffers in December 2024 by adding a BU perspective to the existing national perspective in its O-SII floor methodology.[3] The BU perspective enhances the ECB’s O-SII framework where the ECB’s floor methodology and national methodologies have limitations. The BU perspective is considered by the ECB in addition to the current national perspective, which continues to apply to all O-SIIs in the BU countries (see ECB, 2024).
This enhancement to the ECB’s O-SII framework is motivated by two main objectives. First, the ECB aims to reduce the heterogeneity in O-SII buffers and achieve a more consistent treatment of the relevant institutions across the countries participating in the banking union. Unwarranted heterogeneity in buffer levels, where it leads to the buffer rates being underestimated for systemically important banks at the BU level, could reduce the resilience of the financial sector within the banking union to shocks and could negatively affect financial stability. It also distorts the playing field for banks operating in multiple BU countries by creating a competitive advantage for those based in countries with less conservative requirements. This is particularly relevant for cross-border lending and for the direction of mergers and acquisitions in the banking union (see Figueiras et al., 2021). Second, as already noted by the ECB’s Governing Council in its statement on the G-SIB methodology,[4] the banking union has seen institutional progress leading to harmonised banking regulation, supervision and resolution, with accompanying joint financing arrangements for resolution. This has reduced some of the complexities associated with the failure of a systemically important bank which is active in multiple countries across the banking union. This progress made on the banking union implies that intra-BU cross-border exposures generate a lower systemic footprint than extra-BU exposures of banks operating in the banking union. Accordingly, the ECB’s O-SII methodology has been updated to recognise the progress made on the banking union, in line with the approach taken in the G-SIB framework.
This article describes the BU perspective and how it enhances the ECB’s O-SII framework. Section 2 explains the general concept behind the BU perspective. Section 3 then describes how O-SII scores are computed from the BU perspective, while Section 4 presents the BU floor and its features. Section 5 provides details on implementation arrangements, and Section 6 concludes.
2 The main elements of the BU perspective
The BU perspective involves assessing banks’ systemic importance for the banking union as a whole with the goal of addressing “too-big-to-fail”-related risks at the BU level. To evaluate banks’ O-SII buffers from the BU perspective, the scoring approach recommended by the European Banking Authority (see EBA, 2014) for assessing O-SIIs is applied using the aggregate banking system of the banking union as the reference system. The BU perspective considers O-SIIs at the highest level of consolidation in the banking union; foreign subsidiaries of these banks are considered indirectly as their balance sheets are consolidated by the parent institution.[5] Unlike in the national perspective, the scoring approach in the BU perspective ranks all O-SIIs notified to the ECB consistently according to their systemic importance for the banking union.
The BU perspective is implemented as a minimum standard, the BU floor. This floor is applied to all O-SIIs as designated by national authorities in the banking union. Similarly to the existing ECB floor, the G-SIB methodology and most national O-SII methodologies, a bucketing approach is used rather than a continuous function, in order to limit the volatility of the resulting minimum buffer rates.
The BU perspective recognises the institutional progress made on the banking union in line with the ECB’s approach for assessing G-SIB buffers. In the BU perspective, this adjustment is applied when computing the cross-jurisdictional activity indicators of the O-SII scores. The ASTRA scalar is set to 66% − as in the G-SIB methodology (see BCBS, 2022). This recognises the fact that considerable progress has been made on the banking union, although some elements remain to be completed. As the key objective of ASTRA is to consider the banking union as a single geographical area, taking the BU perspective is a conceptually consistent implementation of this idea in the O-SII framework.
The ECB integrates the BU perspective into the O-SII framework when carrying out the prudential supervision of credit institutions in accordance with the SSM Regulation.[6] Article 1 of the SSM Regulation states that the ECB should carry out the tasks conferred on it “with a view to ensuring the safety and soundness of credit institutions and the stability of the financial system of the Union as well as of individual participating Member States […]”. In addition to microprudential supervisory tasks, Article 5 of the SSM Regulation also confers macroprudential tasks and tools on the ECB. When carrying out its macroprudential tasks, among other things the ECB applies higher requirements for capital buffers than applied by the national competent authorities or national designated authorities of participating Member States to be held by credit institutions at the relevant level in accordance with relevant Union law (i.e. “tops up” the national requirements). The relevant Union law, notably Article 131(5) in conjunction with Article 131(3)(b) of the Capital Requirements Directive (CRD)[7], sets out the O-SII framework. According to Article 131(3) of the CRD, systemic importance shall be assessed on the basis of several criteria. These include the importance for the economy of the Union or of the relevant Member State and the significance of cross-border activities. Currently, national authorities identify O-SIIs and set O-SII buffers using their domestic methodologies. This means that national authorities do not assess the systemic importance of banks for the economy of the European Union – partly due to their lack of data on European banks outside their own jurisdiction. Furthermore, at the time of publication of this article, no national authority had yet recognised the progress made on the banking union by implementing ASTRA in their domestic methodologies. The BU perspective, by contrast, takes an EU-wide perspective to systemic importance and implements ASTRA. It thus complements the national assessments. In the context of Article 5 of the SSM Regulation, the ECB assesses the draft national decisions concerning O-SII buffers using a floor methodology, which, since December 2024, has taken both a national perspective and the BU perspective (see ECB, 2024). If the buffer proposed by a national authority were lower than either of the ECB floors, the ECB would engage in a dialogue with that authority and may use its powers to top-up the national buffer decision in order to address systemic or macroprudential risk.
3 Computing O-SII scores from the BU perspective
The BU perspective uses a scoring approach to assess each O-SII’s systemic importance for the banking union as a whole. These O-SII scores from the BU perspective are computed following the EBA’s guidelines on the criteria for the assessment of O-SIIs (see EBA, 2014) and using supervisory data only, with the BU aggregate as denominator. The definitions of indicators provided by the EBA’s guidelines have been updated to reflect the revisions of the FINREP reporting requirements up to the end of 2023. Furthermore, proxies are used for the intra-financial system liabilities and assets in cases where data needed to follow the EBA definition are not available (for more details, see Annex 1).
The cross-jurisdictional activity indicators are adjusted with ASTRA, where the scalar is set to 66%. The ASTRA-adjusted score is obtained by calculating the difference between the complexity indicator computed using the EBA guidelines (), and the complexity indicator computed under the assumption that all cross-jurisdictional exposures within the banking union are treated as domestic (). This difference is scaled by 0.25 in line with the weight prescribed for the complexity indicator by the EBA guidelines, and by which is set to 66% in line with the G-SIB framework. Finally, this difference is subtracted from the score computed using the EBA guidelines:
[8]
The scalar is applied to both the numerator and the denominator when calculating the adjusted scores.
The payments activity indicator is not available from FINREP and will be calculated using a different data source. As most national macroprudential authorities use T2 data to compute the payments activity indicator, the ECB will also use these data, at the BU level, to estimate the sub-scores of O-SIIs at the BU level. This would lead to the most comprehensive coverage of payments activity in euro within the BU and ensure consistent computation as well as the inclusion in the assessment of all O-SIIs identified in the banking union which participate in T2. Due to data limitations, however, the definition implemented would fall short of the EBA expectation that the payments should be covered at the global consolidated level.[9]
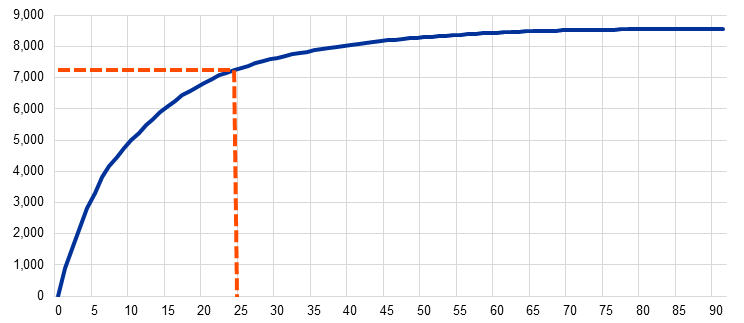
The indicators of systemic importance are calculated for all banks in the banking union that report FINREP data (i.e. more than 2,000 banks at the highest level of consolidation).[10] The reason for this is to have a reference group as comprehensive and stable as possible, and cover the banking system of the banking union for the most part. All O-SIIs in the banking union account for about 85% of the total systemic risk of the aggregate BU banking system, as measured by the O-SII scores from the BU perspective. The risk related to O-SIIs is mostly concentrated in a few O-SIIs that are the largest banks in the banking union. The largest 20 to 30 banks together account for between 70% and 78% of all systemic risk in the banking union (Chart 2).
Chart 2
Cumulative distribution of O-SII scores from the BU perspective
(31 December 2023; x-axis: number of O-SIIs; y-axis: cumulative O-SII score from BU perspective, basis points)
Sources: ECB (supervisory data) and ECB calculations.
Notes: The graph is based on a sample of 90 O-SIIs in the banking union that are on their highest level of consolidation (sorted by score in descending order) and shows the cumulative distribution of about 8,500 basis points across these banks. The red dashed lines indicate that the cumulative O-SII score from the BU perspective of about 7,200 basis points for the top 24 O-SIIs captures about 72% of systemic risk in the banking union.
4 Calibrating the floor in the BU perspective
The relationship between O-SII score from the BU perspective and O-SII buffers could take various shapes. When buffer increases from one bucket to the next are in constant steps, the shape of the relationship implies a constant bucket size for the linear shape, a decreasing size for the convex shape and an increasing size for the concave shape (Figure 1). While many countries assume a linear or concave relationship between O-SII scores and buffers, the G-SIB framework assumes a linear relationship for the score range that is currently populated by G-SIBs, followed by a bigger step size of 1 percentage point rather than 0.5 percentage points between the last populated bucket and the empty bucket, which introduces some convexity into the overall shape.
Figure 1
Shapes and related buckets, assuming constant buffer increments

Source: ECB.
The BU floor is calibrated based on a linear function, mapping the O-SII score from the BU perspective to a minimum buffer rate. A convex shape would provide stronger incentives for the largest banks to reduce their systemic footprint. At the same time, it would be less effective in addressing the heterogeneity observed in buffer rates than a linear or concave floor, given the same fixpoints. A linear floor is simple and aligned with the G-SIB methodology.
Two fixpoints, specified by an O-SII score from the BU perspective and an O-SII buffer rate, determine the actual level of the floor.[11] The first fixpoint is represented by the threshold value above which O-SIIs could in principle face a higher minimum O-SII buffer requirement than under the existing ECB floor. The first fixpoint has been set at a score of 80 basis points and a related buffer rate of 0.5%. This threshold score has been chosen to ensure that banks together accounting for over 70% of systemic risk in the BU banking system will be above this fixpoint.[12] O-SIIs below that point, while being subject to the assessment from the BU perspective, will not be bound by the BU floor. This is because, due to the existing ECB floor, every O-SII is required to have a buffer of at least 0.25%. The second fixpoint will be set at a score of 1,000 basis points and a related buffer level of 2.25%. The floor will be calibrated in such a way that both fixpoints represent the beginning of a new bucket. The step size from one bucket to the next is set at 0.25 percentage points. This implies that O-SIIs will be divided into nine buckets (Table 1). The bucket thresholds are rounded to the nearest lower multiple of five. Similar to the G-SIB framework, the BU floor includes an empty bucket added on top of the last populated bucket to provide a disincentive for the largest banks to grow more systemically important.
Table 1
Enhanced ECB methodology: minimum O-SII buffer rates for combining scores computed in national and BU perspectives after full implementation of BU perspective
|
| Score: BU perspective | ||||||||
|---|---|---|---|---|---|---|---|---|---|---|
|
| below 80 | 80-209 | 210-339 | 340-469 | 470-604 | 605-734 | 735-864 | 865-999 | 1,000 and above |
Score: national perspective | below 750 | 0.25 | 0.50 | 0.75 | 1.00 | 1.25 | 1.50 | 1.75 | n.a. | n.a. |
750-1,299 | 0.50 | 0.50 | 0.75 | 1.00 | 1.25 | 1.50 | 1.75 | 2.00 | 2.25 | |
1,300-1,949 | 0.75 | 0.75 | 0.75 | 1.00 | 1.25 | 1.50 | 1.75 | 2.00 | 2.25 | |
1,950-2,699 | 1.00 | 1.00 | 1.00 | 1.00 | 1.25 | 1.50 | 1.75 | 2.00 | 2.25 | |
2,700-4,449 | 1.25 | 1.25 | 1.25 | 1.25 | 1.25 | 1.50 | 1.75 | 2.00 | 2.25 | |
4,450 and above | 1.50 | 1.50 | 1.50 | 1.50 | 1.50 | 1.50 | 1.75 | 2.00 | 2.25 | |
Source: ECB.
Notes: The scores in the national perspective are computed by national authorities on the basis of EBA (2014). Scores falling on one of the boundaries are assigned to the higher-scoring bucket. “n.a.” indicates score combinations which are not possible, as the O-SII score from the BU perspective cannot be higher than the O-SII score from the national perspective. Banks are designated as O-SIIs by national authorities. All O-SIIs identified by national authorities are expected to have an O-SII buffer of at least 0.25%.
Box 1
Illustration of the dynamics and combined impact of the BU perspective and ASTRA
The enhancements to the ECB’s O-SII floor methodology combine two elements: (i) the measurement of systemic importance from the banking union (BU) perspective, and (ii) the treatment of cross-border exposures within the banking union as partly equivalent to domestic exposures via ASTRA. The combined impact of these two elements on the O-SII buffers depends on the circumstances of the individual banks. Table A illustrates the impact on the minimum O-SII buffer rates.
Consider two countries participating in the banking union. Country 1’s banking system holds 20% of total bank assets in the banking union and is twice the size of Country 2’s banking system. Both of these banking systems consist of three banks of equal size but which differ in terms of cross-border activities within the banking union. For the sake of simplicity, the O-SII scores are defined as a simple average of two sub-scores: one capturing size, measured by a given bank’s total assets; and one capturing cross-border activity, measured by total cross-border intra-BU exposure. Both countries apply the ECB floor methodology to translate the scores into O-SII buffers.
Under these assumptions, the national perspective taken by the two countries leads to substantial differences between their domestic banks’ O-SII buffers. Banks that are active in multiple BU countries receive buffers which are higher, by up to 75 basis points, than the buffers assigned to banks operating in the domestic market only. The buffer levels in the two countries are similar, as they both use the same formula to translate O-SII scores into buffers, and as the scores are normalised at the level of the domestic banking system.
Applying the BU perspective increases the buffers for O-SIIs that are more significant for the banking union and returns a lower floor for the O-SIIs that are less significant for the banking union. The O-SII scores are normalised at the BU level. As Country 1’s banks are more active in the other BU countries than Country 2’s banks, the total score of these banks is also higher. At 2,125 basis points, it exceeds the share of Country 1 in total bank assets in the banking union of 2,000 basis points. The buffer rates for Bank A and Bank C in Country 1 increase, as these two banks score the highest among the six banks due to their size and cross-border activity. The BU floor for the three banks located in Country 2 is lower than the buffer rates calibrated from the national perspective, meaning that it is not binding. This reflects the low weight of Country 2 in the banking union.
Applying ASTRA levels out the playing field between domestic and internationally active banks. Assuming that the ASTRA scaling factor is set to 100%, implying that cross-border exposures within the banking union are equivalent to domestic exposures, the scores of the three banks in Country 1 would be equal from the BU perspective. They add up to the 2,000 basis point share of Country 1 in total bank assets in the banking union. The same would hold for Country 2. Given the larger absolute size of Country 1’s banks, however, their scores from the BU perspective are twice as high as the scores of Country 2’s banks. The resulting floor from the BU perspective increases for the domestically focused banks (e.g. Bank B) and decreases for banks active in multiple BU countries (Bank C and Bank F).
Table A: Illustration of the impact of the BU perspective and ASTRA
| Country 1: 20% weight in the banking union | Country 2: 10% weight in the banking union | ||||||
|---|---|---|---|---|---|---|---|---|
| Bank A | Bank B | Bank C | Country total | Bank D | Bank E | Bank F | Country total |
Total exposure (EUR billions) | 200 | 200 | 200 | 600 | 100 | 100 | 100 | 300 |
Of which cross-border intra-BU exposure (EUR billions) | 100 | 0 | 200 | 300 | 10 | 0 | 90 | 100 |
O-SII score: national perspective (basis points) | 3,333 | 1,667 | 5,000 | 10,000 | 2,167 | 1,667 | 6,167 | 10,000 |
ECB floor: national perspective (percentages) | 1.25 | 0.75 | 1.5 |
| 0.75 | 0.75 | 1.5 |
|
O-SII score: BU perspective, no ASTRA (basis points) | 708 | 333 | 1,083 | 2,125 | 204 | 167 | 504 | 875 |
ECB floor: BU perspective, no ASTRA (percentages) | 1.5 | 0.75 | 2.25 |
| 0.5 | 0.5 | 1.25 |
|
O-SII score: BU perspective, 100% ASTRA (basis points) | 667 | 667 | 667 | 2,000 | 333 | 333 | 333 | 1,000 |
ECB floor: BU perspective, 100% ASTRA (percentages) | 1.5 | 1.5 | 1.5 |
| 0.75 | 0.75 | 0.75 |
|
Notes: For the sake of simplicity, O-SII scores are defined as a simple average of the sub-scores for total exposure and cross-border intra-BU exposure. These sub-scores are calculated as the value of the indicator for a given bank divided by the sum of the indicator values for all other banks in the reference (domestic or BU) banking system, then multiplied by 10,000 basis points. The ECB floor is defined in Table 1. The BU perspective adopts a 66% scaling factor in ASTRA. For illustration purposes only, this example assumes a 100% scaling factor.
5 Implementation of the enhanced methodology
The ECB started applying the enhanced floor methodology as of 1 January 2025, with a BU floor that is capital-neutral at the start and set to increase gradually until 2028. The framework is already being used to assess O-SII buffer decisions notified to the ECB since 1 January 2025. The implementation of the BU floor has been determined to be capital-neutral in 2025 and 2026. After that, the BU floor will increase in two increments. As a result, the enhanced methodology will be fully phased in as of 1 January 2028.
The ECB will disclose the bucket placements of individual O-SIIs every year after the national authorities complete their annual O-SII identification processes. There is a large range in the timing of the O-SII assessments among the 21 BU countries: the first formal decision is usually notified to the ECB in March while the last is notified in early December. As a result, the ECB will provide regular annual updates on the placement of individual O-SIIs on its website in January of the year following the year in which the O-SII decision is taken by the national authorities.[13]
6 Conclusions
The ECB’s enhanced O-SII framework includes both the national perspective and the BU perspective. The ECB will assess each O-SII buffer notification submitted by national authorities on a case-by-case basis against both of the floors in the ECB framework. For each bank, the higher of the two floors will apply. The ECB floors represent the expected minimum O-SII buffers. Thus, if either of the two ECB floors is lower than the applicable O-SII buffer rates proposed by national authorities, there should be no expectation that the O-SII buffer would be lowered.
The enhanced O-SII framework does not alter the competences of the ECB or national authorities for adopting macroprudential measures. Implementing the BU perspective merely entails amending the ECB’s O-SII methodology by also considering an explicit BU perspective, which is not possible for national authorities as they do not have sufficient access to the necessary data. The national authorities are and will remain empowered to designate O-SIIs in their jurisdictions and to set O-SII buffers. At the same time, the role of the ECB is to assess the proposed measures, in particular taking into account the financial stability of the Union as a whole and the importance of O-SIIs for the economy of the Union (Article 1 of the SSM Regulation and Article 131(3) of the CRD) and – if deemed necessary – impose stricter requirements in line with Article 5 of the SSM Regulation.
The BU perspective is expected to reduce the heterogeneity in O-SII buffers, recognise the institutional progress made on the banking union and lessen disincentives to financial integration within the banking union. The enhanced framework will be fully applied by the ECB by 1 January 2028. It will take into account the systemic importance of banks to the banking union and reduce the disparities between cross-border and domestic activities when assessing banks’ systemic importance.
References
BCBS (2012), “A framework for dealing with systemically important banks”, Bank for International Settlements, October.
BCBS (2022), “Basel Committee finalises principles on climate-related financial risks, progresses work on specifying cryptoassets' prudential treatment and agrees on way forward for the G-SIB assessment methodology review”, 31 May.
Behn, M., Cappelletti, G., Kaltwasser, P., Kolb, M., Pawlikowski, A., Tracol, K., Salleo, C. and van der Kraaij, A. (2017), “ECB floor methodology for setting the capital buffer for an identified Other Systemically Important Institution (O-SII)”, Macroprudential Bulletin, Issue 3, ECB, June.
Board of Governors of the Federal Reserve System (2015), Calibrating the GSIB Surcharge, 20 July.
Dimitrov, D. and van Wijnbergen, S. (2023), “Macroprudential Regulation: A Risk Management Approach”, Working Papers, No 765, De Nederlandsche Bank, February.
EBA (2014), “Guidelines on the criteria to determine the conditions of application of Article 131(3) of Directive 2013/36/EU (CRD) in relation to the assessment of other systemically important institutions (O-SIIs)”, EBA/GL/2014/10, 16 December.
EBA (2020), “EBA report on the appropriate methodology to calibrate O‐SII buffer rates”, EBA/Rep/2020/38, 22 December.
ECB (2022a), “ECB response to the European Commission’s call for advice on the review of the EU macroprudential framework”, March.
ECB (2022b), “Governing Council statement on the treatment of the European banking union in the assessment methodology for global systemically important banks”, 27 June.
ECB (2024), “Governing Council statement on macroprudential policies – the ECB’s framework for assessing capital buffers of other systemically important institutions”, 20 December.
Figueiras, I., Gardó, S., Grodzicki, M., Klaus, B., Lebastard, L., Meller, B. and Wakker, W. (2021), “Bank mergers and acquisitions in the euro area: drivers and implications for bank performance”, Financial Stability Review, ECB, November.
Greco, M., Grodzicki, M. and Vogel, U. (2025), “Heterogeneity in buffers set for systemically important banks in the European banking union”, Macroprudential Bulletin, Issue 30, ECB, August.
Jiron, A., Passmore, W. and Werman, A. (2021), “An empirical foundation for calibrating the G-SIB surcharge”, Working Papers, No 935, Bank for International Settlements, 31 March.
Sigmund, M. (2021), “The capital buffer calibration for other systemically important institutions – Is the country heterogeneity in the EU caused by regulatory capture?”, Scottish Journal of Political Economy, Vol. 69, Issue 5, pp. 533-563.
Annex
Methodology for computing O-SII scores from the BU perspective
Criterion | Indicator (Weight) | Data used for O-SII score |
|---|---|---|
Size | Total assets (25%) | F 01.01, row 380, column 010 |
Importance (including substitutability/financial system infrastructure) | Value of domestic payment transactions (8.33%) | Calculated using T2 data* |
Private sector deposits from depositors in the EU (8.33%) | F 20.06, rows 120+130, column 010, EU countries (z-axis). If missing, use F 08.01, rows 260+310, columns 010+020+030 | |
Private sector loans to recipients in the EU (8.33%) | F 20.04, rows 190+220, column 010, EU countries (z-axis). If missing, use F 18.00.a, rows 120+150+196+197+226+227, column 010 | |
Complexity /cross-border activity | Value of OTC derivatives (8.33%) | F 10.00, rows 300+310+320, column 030 + F 11.01, rows 510+520+530, column 030 + F 11.02, rows 240+250+260, column 010 |
Cross-jurisdictional liabilities (8.33%) | F 20.06, rows 010+040+070, column 010, all countries except home country (z-axis)** | |
Cross-jurisdictional claims (8.33%) | F 20.04, rows 010+040+075+080+140, column 010, all countries except home country (z-axis)** | |
Interconnectedness | Intra-financial system liabilities (8.33%) | F 20.06, rows 020+030+050+060+100+110, column 010, all countries (z-axis). If missing, use F 08.01.a, rows 160+210, column 010+020+030+034+035 + F10.00 rows 300+310, column 020 + F11.01 rows 510+520, column 020, all countries (z-axis)*** |
Intra-financial system assets (8.33%) | F 20.04, rows 020+030+050+060+110+120+170+180, column 010 + F01.01, row 040, column 010, all countries (z-axis). If missing, use: F 18.00, rows 040+050+100+110+184+185+194+195+214+215+224+225, column 010 + F 10.00, rows 300+310, column 010 + F 11.01, rows 510, 520 column 010 + F 04.01, rows 30+40, column 010 + F 04.02.1, rows 020+030, column 010 + F 04.03.1, rows 020+030, column 010 If missing, use: F 04.01, rows 030+040+090+100+150+160, column 010 + F 04.02.2, rows 030+040+090+100+150+160, column 010 + | |
Debt securities outstanding (8.33%) | F 01.02, rows 050+090+130, column 010 |
Source: ECB.
Notes: * No information available in FINREP.
** In line with ASTRA, exposures to BU countries are included with a scaling factor of (1-66%).
*** These are carrying amounts other than hedge accounting of deposits from credit institutions and other financial corporations.
The authors would like to thank Matteo Greco and Jaspal Singh for their research assistance.
See Behn et al. (2017). The revised floor methodology has been applied since 1 January 2024 following a review of the ECB’s O-SII floor methodology.
See ECB (2024).
See ECB (2022b).
About 90 of the 120 or so O-SIIs in the BU are banking groups at the highest level of consolidation in the banking union. The ECB will assess the O-SII buffer decisions concerning these banks from the BU perspective and against its existing floor. The O-SII buffer decisions concerning the remaining 30 or so O-SIIs which are subsidiaries of other BU O-SIIs will only be assessed from the national perspective.
Council Regulation (EU) No 1024/2013 of 15 October 2013 conferring specific tasks on the European Central Bank concerning policies relating to the prudential supervision of credit institutions (OJ L 287, 29.10.2013, p. 63).
Directive 2013/36/EU of the European Parliament and of the Council of 26 June 2013 on access to the activity of credit institutions and the prudential supervision of credit institutions, amending Directive 2002/87/EC and repealing Directives 2006/48/EC and 2006/49/EC (OJ L 176, 27.6.2013, p. 338).
For a description of ASTRA, see ECB (2022b). The EU O-SII framework captures the cross-border activities as part of the complexity indicator, differing from the G-SIB framework, which treats cross-border activities as a separate dimension of systemic importance.
Globally consolidated data are only available for a subset of O-SIIs which report payments data for the purpose of identifying G-SIBs. This means that using such data is considered less meaningful than the TARGET data that offer a broad coverage of the payments made in the euro area.
Banks which do not report FINREP data are generally very small. Their exclusion – made necessary by the lack of available data – does not materially impact the results of the assessment.
The equal expected impact (EEI) approach, which is often used for TBTF buffer calibration, was not applied to inform the BU floor calibration. While the underlying assumptions of the EEI approach may support different shapes for calibrating a floor (see, for instance, Board of Governors of the Federal Reserve System (2015) for a concave shape and Jiron et al. (2021) for a convex shape), applying the approach requires strong assumptions to be made and often the outcome to be rescaled. Furthermore, the EEI approach requires historical data on bank losses. These data may not be available for all countries in the banking union. Even if they are available, they may not well reflect the current environment that banks are operating in.
As at the end of 2023, there were 24 O-SIIs whose O-SII scores from the BU perspective stood above this threshold. Their share is similar to the share of G-SIBs in the reference banking system used to determine G-SIB scores and to the average share of O-SIIs in total banking assets in EU Member States (see EBA, 2020).
The disclosures will be made via updates to the list of macroprudential measures on the ECB’s website.