
- PRESS RELEASE
Climate change indicators: November 2025
27 November 2025
- Euro area issuances and holdings of sustainable debt securities continue to grow, albeit at a slower pace, with new breakdowns by currency, maturity and fixed vs. variable interest rate providing deeper insights
- Transition risk and carbon emissions of euro area financial sector portfolios continue to decline despite increased portfolio size
- Physical risk indicators highlight growing significance of temperature and precipitation-related risks, with significant variations across euro area countries
The European Central Bank (ECB) has released updated statistical climate indicators designed to enhance the financial sector's ability to assess developments in sustainable finance as well as transition and physical risks related to climate change. These updates incorporate advanced methodologies, new datasets and adjustments to reflect inflation effects, ensuring more precise tracking of decarbonisation efforts and the intensifying impact of climate-related hazards.
Sustainable finance indicators
The indicators on issuances and holdings of sustainable debt securities in the euro area, originally published in January 2023, are designed to offer a comprehensive view of the funds raised to support sustainable projects, while also capturing the growing demand for such instruments as investment opportunities. They bring greater transparency to financial markets and support the inclusion of climate change considerations into the ECB’s monetary policy, financial stability and economic analyses.
Since their launch, the indicators have been repeatedly enriched to offer deeper insights into the market for sustainable finance and to better serve policymakers, market participants and analysts.
As of November 2023, data on sustainable debt securities are published for two levels of assurance: i) instruments with a second party opinion (SPO) validating the sustainability claims of the issuer, and ii) all sustainable instruments, i.e. with all degrees of assurance, including also only self-labelled instruments. Building on this progress, in September 2024 additional breakdowns were incorporated into the indicators. These are published as official European System of Central Banks (ESCB) statistics.
Chart 1
Sustainable finance indicators
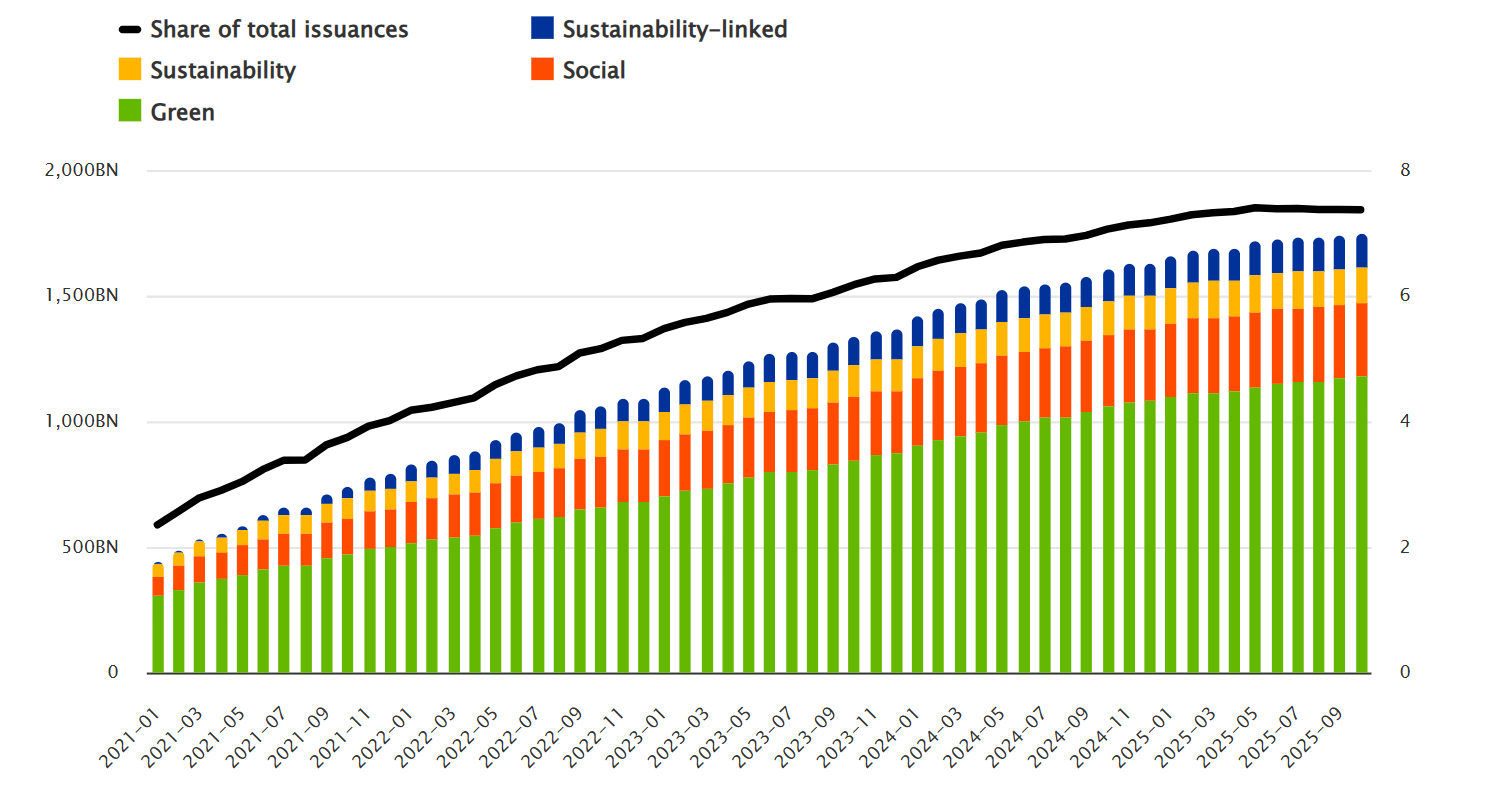
a) Euro area issuances of sustainable debt securities – all levels of assurance |
|---|
(Left-hand scale: EUR, outstanding amounts at face value; right-hand scale: percentages) |
 Released January 2023 |
Sources: Source: Centralised Securities Database (CSDB).
Notes: “Share of total issuances” refers to the amount of all sustainable securities as a share of all debt securities issued in the euro area.
b) Euro area issuances of sustainable debt securities – SPO issuances as a share of total |
|---|
(Percentages) |
 Released November 2023 |
Sources: Source: Centralised Securities Database (CSDB).
Notes: “Share of issuances with SPO” refers to sustainable debt securities with a second party opinion as a share of all sustainable debt securities issued in the euro area.
c) Euro area issuances of sustainable debt securities – currency of denomination EUR |
|---|
(Percentages) |
 Released November 2025 |
Sources: Source: Centralised Securities Database (CSDB).
Notes: “Share of issuances with currency denomination EUR” refers to sustainable debt securities denominated in EUR as a share of all sustainable debt securities issued in the euro area.
This latest update, released in November 2025, further expands the scope of the indicators with new aggregates on sustainable debt securities issuances. These aggregates provide breakdowns by original maturity, currency of denomination and interest rate type, offering a more granular view of the market. In doing so, the new breakdowns also address the reporting requirements in the context of the G20 Data Gaps Initiative Recommendation 4 on Climate Finance, supporting the availability of comparable data on sustainable finance across the G20 economies.
The outstanding amount of sustainable debt securities issued in the euro area has nearly quadrupled in the last four years, rising from EUR 453 billion in January 2021 to EUR 1.74 trillion in September 2025. However, more recently, the growth rate has slowed, as the total euro area issuances of sustainable debt securities increased by 10% over the past 12 months, compared with 20% the year before. Similar trends are observed for holdings of sustainable debt securities in the euro area. Total holdings continue to grow, reaching EUR 1.96 trillion in June 2025, 14% higher than in June 2024, while the growth rate the year before was 20%.
Transition risk indicators
The latest release of carbon emissions and transition risk indicators confirms an overall decreasing trend of climate exposure and risk in euro area financial institutions portfolios. This points to a decarbonisation of banks’ portfolios without a reduction in the volume of financing or investing.
For banks’ loans portfolios (Chart 2, panel a), latest calculations and estimations show that in the period 2018-2023 financed emissions decreased by 45% (from 289 to 157 million tCO2 eq.[1]); carbon intensity decreased by 43% (from 44 to 25 tCO2 eq. per million EUR); weighted average carbon intensity adjusted for inflation decreased by 41% (from 130 to 77 tCO2 eq. per million EUR); and carbon footprint decreased by 54% (from 80 to 37 tCO2 eq. per million EUR).
The decrease in financed emissions comes despite a 17% increase in the portfolios of in-scope instruments and stable loans portfolios coverage of 74%.
For banks’ securities portfolios (Chart 2, panel b), latest calculations and estimations show that in the period 2018-2024 financed emissions decreased by 16% (from 43 to 36 million tCO2 eq.); carbon intensity decreased by 41% (from 183 to 108 tCO2 eq. per million EUR); weighted average carbon intensity adjusted for inflation decreased by 39% (from 202 to 124 tCO2 eq. per million EUR); and carbon footprint decreased by 48% (from 162 to 84 tCO2 eq. per million EUR).
The decrease in financed emissions comes despite a 61% increase in the portfolios of in-scope instruments and an increase in securities portfolio coverage of 4.5% (from 88.5% to 93%).
Chart 2
Carbon emissions indicators for loans and securities portfolios of euro area banks at consolidated group level
a) Loan portfolios | b) Securities portfolios |
|---|---|
(right-hand scale: million tonnes of Scope 1 CO2 emissions eq.,left-hand scale: tonnes of Scope 1 CO2 emissions eq. per million EUR of revenue) | (right-hand scale: million tonnes of Scope 1 CO2 emissions eq.,left-hand scale: tonnes of Scope 1 CO2 emissions eq. per million EUR of revenue) |
 |  |
Sources: ESCB calculations based on data from Anacredit, the Register of Institutions and Affiliates Data, Securities Holdings Statistics by Sector and Institutional Shareholder Services.
Notes: Securities include listed shares and debt securities. “Banks” does not include central banks. Weighted average carbon intensity is adjusted for inflation and exchange rate.
Physical risk indicators
Physical risk indicators reveal euro area financial institutions’ exposure to climate-related risks arising from natural catastrophes – such as floods, windstorms and wildfires – as well as phenomena like heat stress and water stress.
Focusing on exposures classified as being at the highest risk for metrics related to temperature and precipitation – namely the standardised precipitation index (SPI), consecutive dry days (CDD) and water stress – the latest data highlights the growing significance of these risks across various climate scenarios[2].
Under a high-emission scenario (RCP8.5), the SPI indicates a further increase in high-risk exposures, with a rise of over 20 percentage points. By the end of the century, almost all exposures will fall into the highest risk categories, reflecting elevated risks of extreme precipitation patterns, including both extreme dry and extreme wet conditions (Chart 3, panel a).
For the CDD metric, approximately 5% of current exposures are associated with debtors located in areas where CDD exceeds 40 days. This proportion is projected to roughly double – increasing by around five percentage points – irrespective of the climate scenarios or time horizon considered. Water stress also emerges as a significant concern, with high-risk exposures increasing by 11 percentage points under the pessimistic scenario by the end of the century (rising from 28% to 39% of the portfolio classified in the highest risk category).
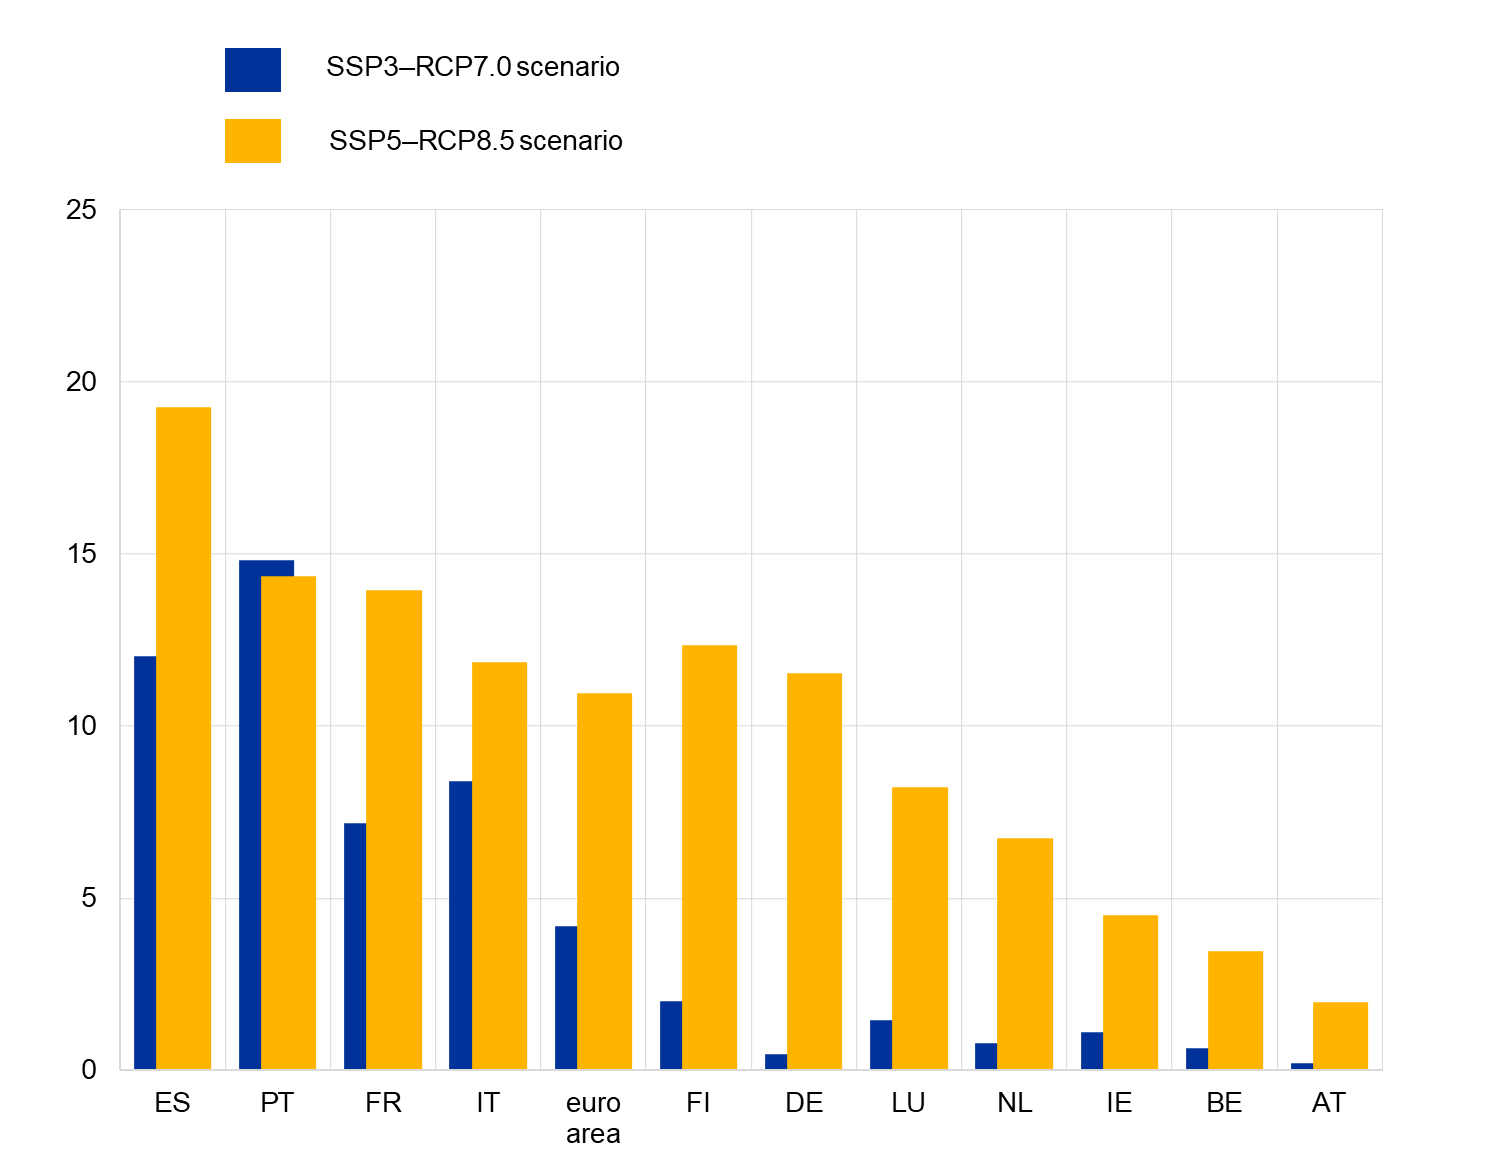
Examining water stress, the physical risk indicators reveal substantial differences in exposure to water stress across the euro area (Chart 3, panel b). Southern European countries are among the most affected. Spain leads with the highest increase by 2100, 19 percentage points under the higher-emission scenario (SSP5–RCP8.5) and around 12 percentage points under the lower-emission scenario (SSP3–RCP7.0), reflecting the country's extreme vulnerability to future water stress.
Portugal and France follow, with a total increase of 14 percentage points under the higher-emission scenario by 2100. For Portugal scenario differences are minimal, while France sees a smaller increase of around seven percentage points under the lower-emission scenario.
In contrast, countries in northern Europe, such as Belgium, Ireland and the Netherlands, exhibit smaller increases in the highest risk category, particularly under the lower-emission scenario. These variations align with the geographical distribution of water stress and highlight the diverse challenges faced by different regions within the euro area.
Chart 3
Change in high physical risk exposures of euro area financial institutions from the historical baseline across different climate scenarios and time horizons
a) Temperature and precipitation-related hazards | b) Water stress by countries, end-century |
|---|---|
 |  |
Sources: ESCB calculations based on data from Anacredit, the Register of Institutions and Affiliates Data, Securities Holdings Statistics by Sector, the Intergovernmental Panel on Climate Change Interactive Atlas, and the World Resource Institute.
Notes: The reference period is December 2024. Values show the percentage point changes in exposures categorised in the highest risk category (Score 3) compared with the historical baseline for each hazard. Portfolio exposures cover loans, debt securities and equity portfolios of euro area financial institutions vis-à-vis non-financial corporations. Historical and projection estimates are based on varying reference periods depending on the hazard considered. For more information, please refer to the Technical Annex. Financial institutions include deposit-taking corporations except central banks (S122), non-money market fund investment funds (S124), insurance corporations (S128) and pension funds (S129). Risk scores are not comparable across hazard types as they rely on different methodologies and sources.
RCP stands for Representative Concentration Pathways. RCP4.5. corresponds to radiative forcing of 4.5 W/m² by the end of the century and is considered a moderate scenario. RCP8.5 assumes a high GHG emissions scenario, leading to radiative forcing of 8.5 W/m² by 2100, and is considered a worst-case scenario.
SSP stands for Shared Socioeconomic Pathway. The SSP3-RCP7.0 and SSP5-RCP8.5 scenarios, defined in the IPCC Sixth Assessment Report (AR6), pair socio-economic pathways with corresponding climate-forcing levels. SSP3-RCP7.0 (“Regional rivalry”) describes a fragmented world with weak international cooperation, limited technological progress and high greenhouse-gas emissions resulting from regionalised, inefficient development. SSP5-RCP8.5 (“Fossil-fuelled development”) depicts a globally connected, high-growth world reliant on fossil fuels, leading to very high emissions by the end of the century.
For media queries, please contact: Benoit Deeg, tel.: +49 172 1683704.
Notes
- To access the statistical climate indicators, visit the ECB’s website. For further details on the methodologies, data sources, and findings, consult the accompanying Statistics Paper and refer to the technical annex.
- The aggregated data for the sustainable finance indicators are published on the ECB Data Portal as part of the CSDB-Derived Securities Issues Statistics (CSEC) and the Securities Holdings Statistics (SHSS) datasets:
- Securities issues
- Securities holdings
CO2 eq. stands for CO2 equivalent: since not all greenhouse gases have the same warming effect, their emissions are converted into an equivalent amount of CO2 that would have the same global warming impact over a 100-year period.
For details on climate scenarios, please refer to the Technical Annex.